
Trading Apologist
The Weekly Market Digest · Sunday, October 18, 2026
Hi everyone,
I hope you are all having a good weekend and were able to recharge after the heavier week in markets last week. Before the new week kicks off, here is a look back at the important posts from last week.
The week in brief
The big story this week was inflation, and it was not friendly. CPI came in hot and got sold hard, then PPI printed at 1.3% against a 0.6% forecast, and the market's response was to price in roughly 89% odds of a rate hike by December while buying bonds on the bet that higher rates slow things down. Thursday's rally turned out to be a dead cat bounce, and by Friday both major indices closed lower but ended the week sitting right on support. Daily support on the indices argues for a near-term bounce, but a lot of individual charts are already breaking down from their weekly RSI levels, which I like to watch as a leading indicator, and that points to more pressure ahead.
On the earnings side, 26 companies reported and 81% beat estimates, but the tape was not rewarding them for it, with an average price reaction of minus 1.4 percent across reporters. Banks had a solid 80% beat rate and still saw negative reactions, which tells you something about where sentiment is right now. Next week brings the start of tech earnings, where strong forward guidance will be needed to turn sentiment around on the AI trade.
Beyond the macro, we covered a lot of ground this week, including MSTR and MSCI index pressure, AAPL hitting a new high, GOOGL's quantum result landing in a major journal, the chip tape extending what looks like its longest slide since 2008, CoreWeave's bond yields climbing above 15%, and a full Anthropic investor day.
Going into the week ahead, my base case for a positive Q4 is still on the table, but it is most likely delayed into November now. We should watch the indices here: a further breakdown to a lower low increases the odds of a lower high forming on the next bounce, which would suggest a longer stretch before we see a real rally again. Adding to the pressure is oil back above $100 and credit splitting between public and private markets, so the honest read right now is to stay cautious and adapt as new information comes in.
All that aside, we pushed some useful updates to the AI Trade Desk this week, including a new options volatility indicator for selling calls and puts. This is the kind of tool that is only possible outside of TradingView, where we can pull in real-time options market data. On top of that, the Pro tier now gets Morning Briefs, Options Flow was added, and the entire desk picked up a 33% speed boost. Miles also released new demo overviews to help everyone get up to speed on the new tools.
Asset Watch
Single-name setups worth a look.
Asset Watch: MSTR, How Long and How Hard the MSCI Pressure Lasts · Oct 17
MSCI finalized new non-operating company rules and Strategy fails its own May simulation screens, with the removal list due November 11 and index fund selling hitting after the close on November 30. MSTR fell 9.56% on Friday to $136.83 on heavy volume, rejecting from the $150 neckline that has now flipped to resistance, though the Nasdaq was also down 2.14% on the day. Forced selling estimates range from Strategy's 3.1% of shares to JPMorgan's $2.8 billion figure, and nothing here delists MSTR, touches STRC, or forces Strategy to sell Bitcoin.
Asset Watch: AAPL Hits a New High as the iPhone Duo Sells Out in Minutes · Oct 16
Pre-orders for the iPhone Duo, Apple's first foldable, sold out within half an hour of opening, with US store delivery estimates sliding to January 25, 2027 for every configuration. AAPL ran to a new all-time high near $350 in pre-market trading before giving it back at the open as the Nasdaq slipped. The sellout reads less clean than usual because Apple is believed to have built far fewer units than a normal launch, so the demand signal is real but the supply picture is murky.
Asset Watch: ALB · Oct 14
Mizuho upgraded Albemarle to Buy with a $130 target, and the reason that matters is the thesis has almost nothing to do with EVs. Analyst John Roberts lifted his 2027 lithium carbonate forecast to $22,500 per metric ton from $18,375 because utility-scale battery storage is absorbing lithium faster than forecast, pushing his 2027 demand estimate up about 10% while supply stayed flat. ALB has a bullish divergence on the daily chart and reports November 4, and our other chemicals trade EMN has one too ahead of its October 29 report.
Also this week
The Weekly Alpha
The week's flagship posts: the market recap, the live calls, and the watchlist review.
Weekly Trade Recap: Week of October 13-16, 2026 · Oct 18
This week ran to 17 trades across 13 names, the busiest in the last month, and a defensive one. I cleared out the January contracts early on ENTG, NVDA, and MRVL, took the IBIT leverage off, and finished Friday in a reduced position. On the market, a bounce is possible with gaps closed and the indices on key RSI support, but SMH is the one chart not on support and suggests a couple more days of pressure are possible before any relief. I also want to give you a heads up that family care for my elderly father may pull me away from active trading for a few weeks, though I will keep monitoring everything and providing updates.
Weekly Market Prep Zoom Call - 10.12.26 · Oct 12
We opened the weekly prep call with context on the CXMT-driven semiconductor selloff and the thin bond-market-closed session, then walked through why last Tuesday's S&P record carries well under a 1% historical chance of being a cycle top. The bull market turned four years old with a 21.6% annualized return, second only to 1982 to 1987 among runs of this length, and the VIX has held between 14 and 20 for 51 sessions, the longest streak since 2012. We also covered why the 1989 and 1978 parallels matter for where we go from here.
Markets & Macro
The bigger picture across rates, commodities, and the tape.
Q3 Earnings Week One: Banks Delivered, Got Sold, and May No Longer Be the Tell · Oct 17
The S&P 500 fell 1.95% this week and the Nasdaq dropped 4.48%, the worst week for both since June, with Friday's selling driven by chips, oil above $100, and CoreWeave's debt stress rather than earnings. The six largest US banks earned a combined $43.5 billion, Goldman beat by more than 30%, and all six stocks still closed down on their report day. I have long said banks need to lead for a rally to last, but with lending moving to private credit and growth riding on AI capex, I worry the next credit problem will not show up in bank earnings first.
September CPI: Gasoline Was Half the Pressure, Shelter Was the Rest · Oct 14
September CPI ran hot on both lines, with the annual rate climbing to 3.7% against 3.6% expected and core a tenth above forecast at 2.6%. Gasoline jumped 9.1% on the month and accounted for over half of the increase, but shelter accelerated to 0.4% and services stayed sticky, and that is the part the Fed will weigh on October 28. The 10-year yield jumped back above 5.30% and the October 28 Fed decision moved back to a coin flip at 48% for a hike on Polymarket, up from under 20% the prior week.
Hot PPI, Hot Retail Sales, Falling Yields: What the Market Is Pricing · Oct 15
September PPI came in at 1.3% against a 0.6% forecast, the biggest monthly jump since March 2022, with gasoline at the producer level up 20.3% doing most of the work, though core PPI also rose 0.5% and sits 5.0% above a year ago. Retail sales beat at 0.8% versus 0.3% expected, but strip out autos and gas and the real gain was just 0.2%. The bond market is already buying despite the hot prints, with the 10-year yield dropping to 5.07%, and Polymarket odds of an October hike bounced back to 26% on the data.
Also this week
Bitcoin: Fastest Cycle Ever · Oct 13
Sector Relative Strength
Week of October 12 · % change vs prior week's close
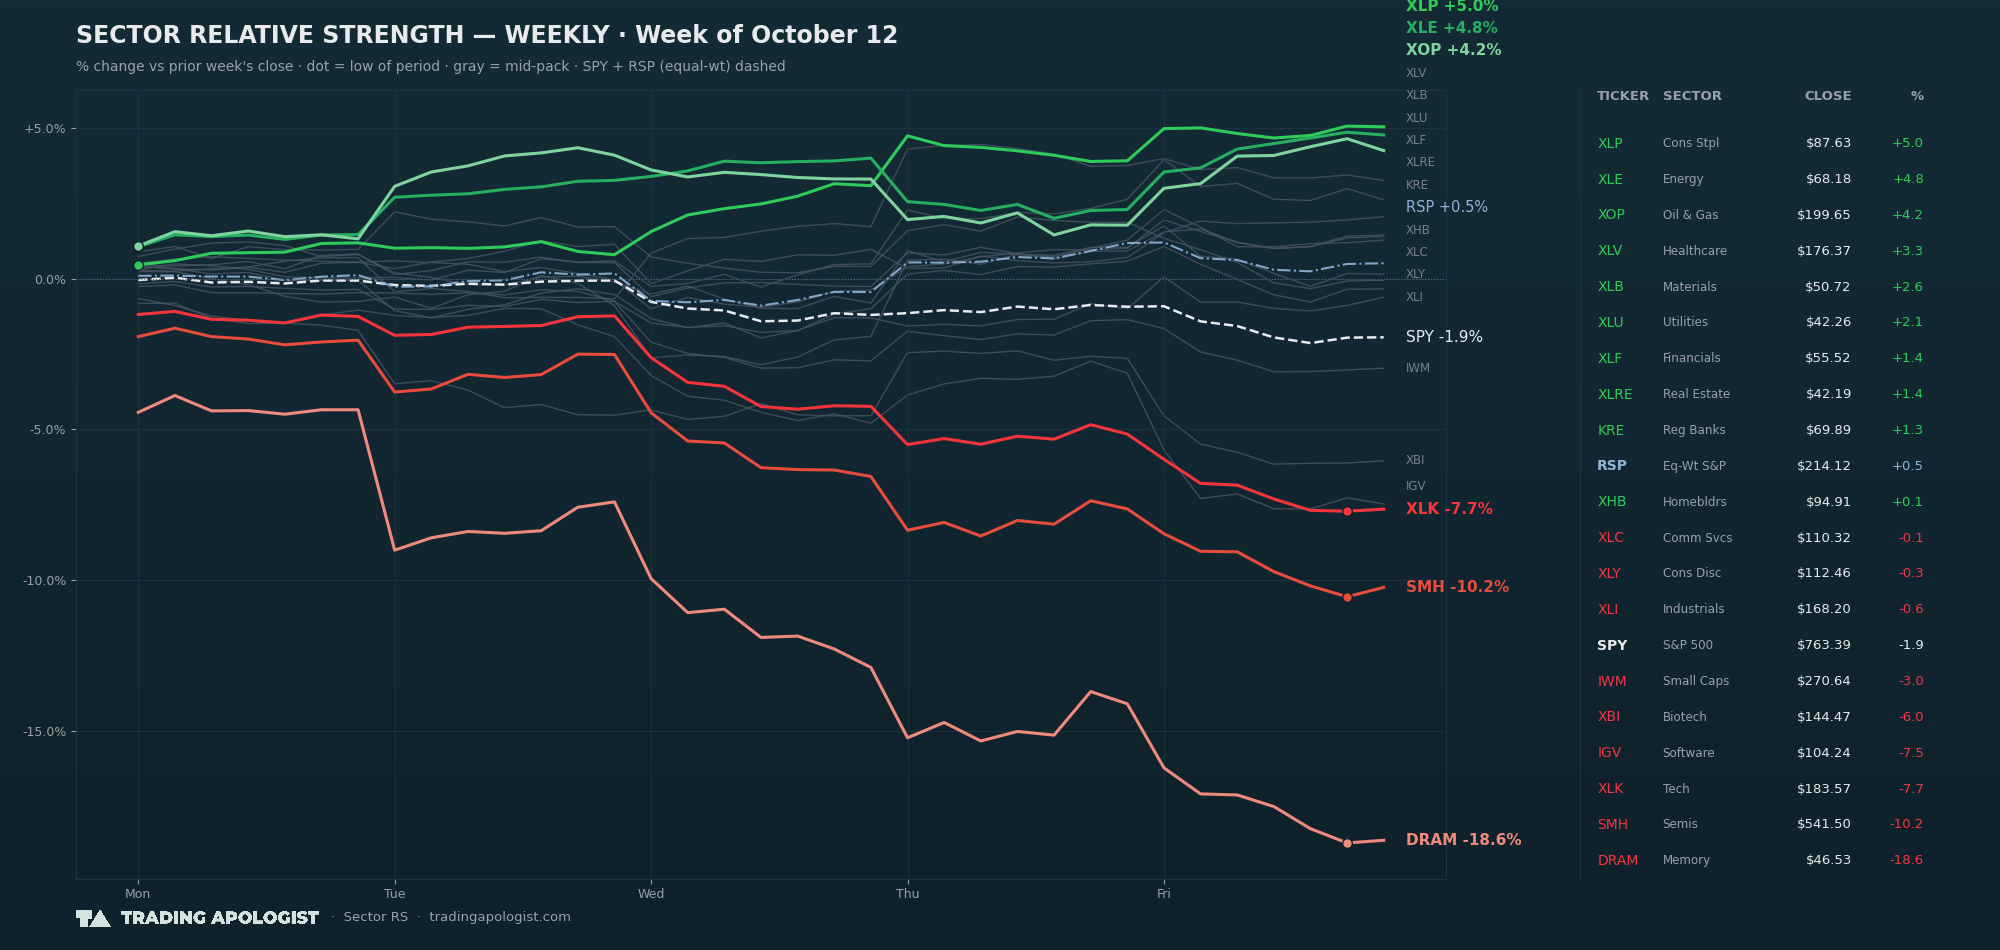
Cons Staples (XLP)+5.03%
Energy (XLE)+4.76%
Oil & Gas E&P (XOP)+4.24%
Healthcare (XLV)+3.26%
Materials (XLB)+2.61%
Utilities (XLU)+2.05%
Financials (XLF)+1.44%
Real Estate (XLRE)+1.40%
Regional Banks (KRE)+1.28%
Homebuilders (XHB)+0.15%
Comm Services (XLC)-0.05%
Cons Discretionary (XLY)-0.35%
Industrials (XLI)-0.62%
Small Caps (IWM)-2.98%
Biotech (XBI)-6.05%
Software (IGV)-7.48%
Technology (XLK)-7.65%
Semiconductors (SMH)-10.25%
Memory (DRAM)-18.64%
S&P 500 (SPY)-1.95%
Equal-weight S&P (RSP)+0.51%
Market Recaps
Every market recap from the week in one place: the daily and morning notes plus the weekly recap.
Overview Weekly Market Recap - Oct 16, 2026
Tuesday Daily Market Recap: Oct 13, 2026
Thursday Daily Market Recap - Oct 15, 2026
Community & Tool Updates
Indicator releases, new tools, events, and community happenings.
AI Trade Desk Guide: Updated Platform Overview · Oct 18
Miles has recorded a fresh 35-minute demo of the AI Trade Desk covering the full platform, and it replaces the old overview video. Supercharts now carries my open trades and TradingView watchlist on the sidebar, synced automatically alongside news, analyst actions, and insider activity. The Deep Read walks through our full analysis process and returns a summary with conviction, entry, stop, targets, and scenarios, and Pro members also see where the systems disagree so you can make your own call.
AI Trade Desk Guide: Volatility Adjusted Yield for Options · Oct 17
Miles added a new indicator to the AI Trade Desk called Volatility Adjusted Yield for Options, available to Plus and Pro members at the bottom of the indicator list. Its one job is to find moments when the volatility risk premium is wide enough to be worth selling, comparing implied volatility to realized volatility against the stock's own history, with a default gate at the 80th percentile. It is not an entry or exit signal but a timing tool for anyone running the wheel strategy, partially hedging, or collecting premium while comfortable taking assignment.
LEAPS Rules: How to Pick, Size, and Exit Long-Dated Calls · Oct 12
There is no magic IV number for LEAPS, and this post lays out the full framework for picking, sizing, and exiting them. Start with IV Percentile, then IV Rank, then absolute IV, and remember that volatility matters far less on a LEAPS than on a short swing call. Every LEAPS begins with the chart and a thesis, not the options chain, and at 90 to 120 days left you close or roll unless the market is in a clear uptrend.
Also this week
News
The stories that moved names on our radar.
A Calmer Read on CXMT’s Memory Chip Claim · Oct 13
SK Hynix fell 10.09% and Samsung fell 7.39% in Seoul on the CXMT story, but a calmer read shows CXMT has no EUV machines and its new 4F² cell design is about squeezing more out of older tools, not leaping past the leaders. Samsung and SK Hynix are working on the same design with better equipment, and nobody has solved the yields yet. The 2027 to 2028 competitive window and the high-bandwidth memory gap are unchanged until CXMT can show specs and a server customer.
CoreWeave Bond Yields Hit 15% as Borrowing Costs Climb · Oct 13
The yield on one of CoreWeave's bonds crossed 15.1% this week, up from near 12% in early September, which is probably adding to the pressure on IREN, CLSK, and other AI data center builders that rely on borrowed money. CoreWeave carried about $35 billion of debt at the end of June and plans to spend $35 billion to $39 billion this year, with interest expense of $860 million to $940 million in Q3 alone. This is the debt concern we have flagged on CoreWeave for some time, and rising yields in its bonds are a signal worth watching.
Anthropic Shows Investors $16.8 Billion in Q3 Revenue, and Its Pre-IPO Price Falls Anyway · Oct 14
Anthropic reported $16.8 billion in Q3 revenue, up roughly 45% from Q2, but that number is gross: they book the full amount customers pay through Amazon and Google and expense the partners' cut afterward, so it does not compare cleanly to OpenAI's net figure. On standard accounting the company still loses money, and the pre-IPO perpetual on Liquid slipped below a $2 trillion implied valuation, down about 10% over the past month. The broader market selloff that day was driven by a hot September CPI print, not Anthropic specifically.
Also this week
Earnings Reports
Every earnings print I covered this week, linked to the full post.
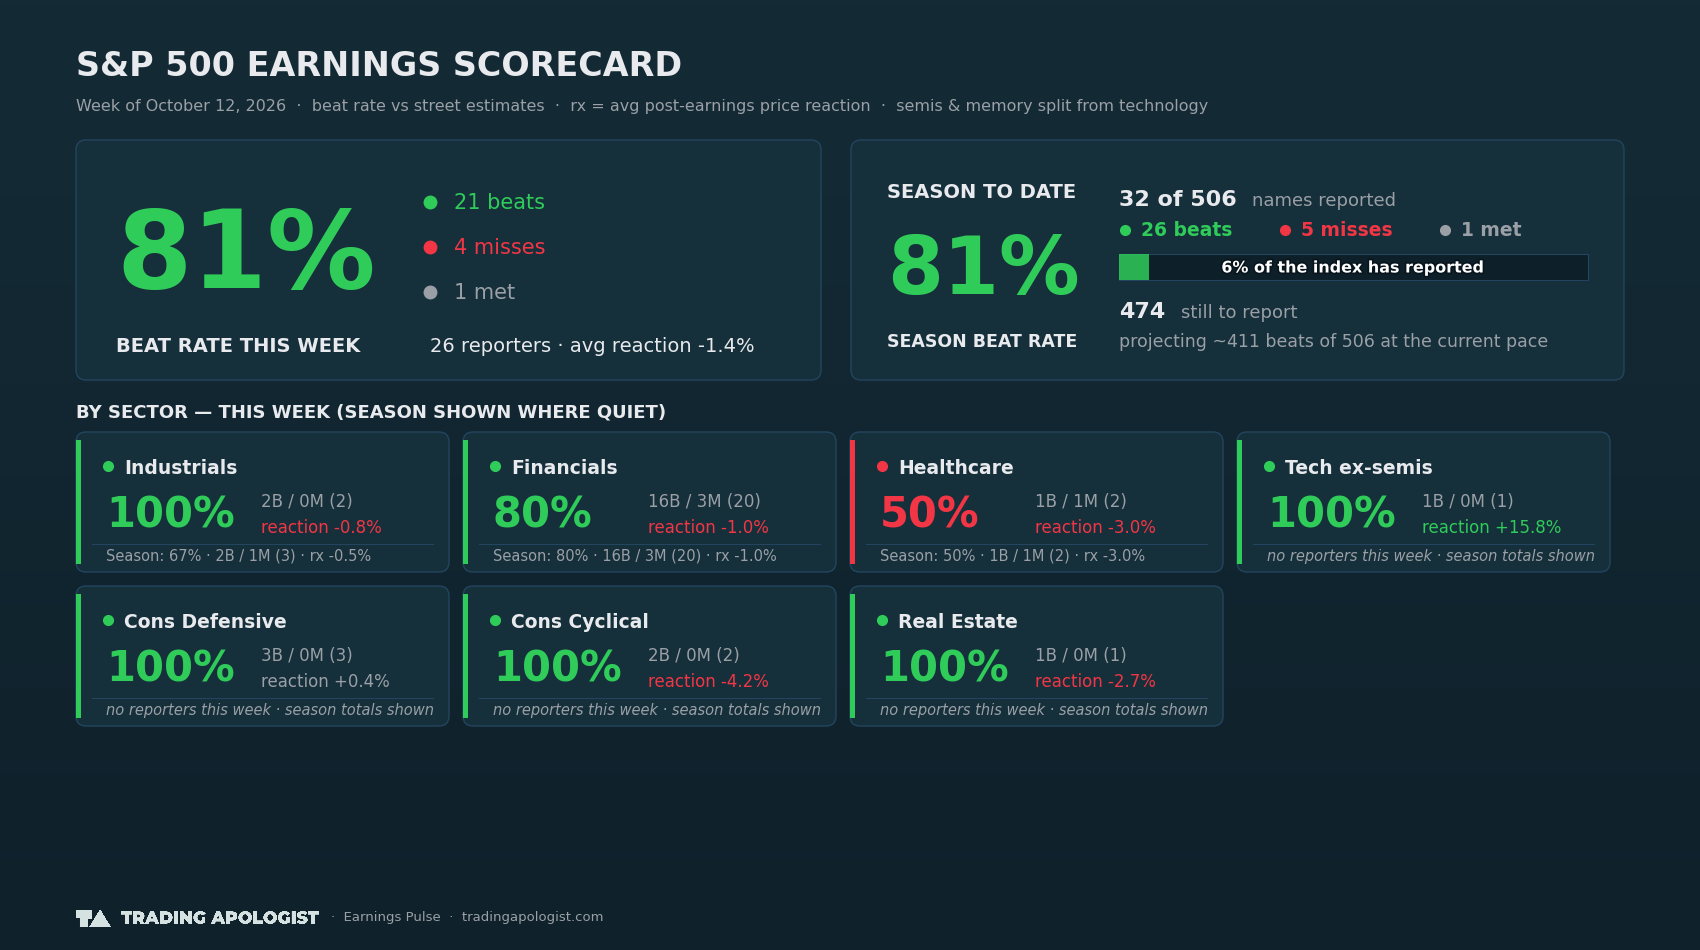
We saw 21 beats, 4 misses, and 1 in line with estimates from 26 reporters, for an 81% beat rate. The tape treated reporters poorly overall, with an average price reaction of minus 1.4%.
Industrials was the strongest sector with a 100% beat rate and a minus 0.8% average reaction, while Healthcare was the weakest at 50% and minus 3.0%. That is broadly in line with the longer run pattern, since Financials also had a solid 80% beat rate but still saw a negative average reaction.
Not a member? You are seeing the free weekly summary. Join the Patreon to read the full posts.