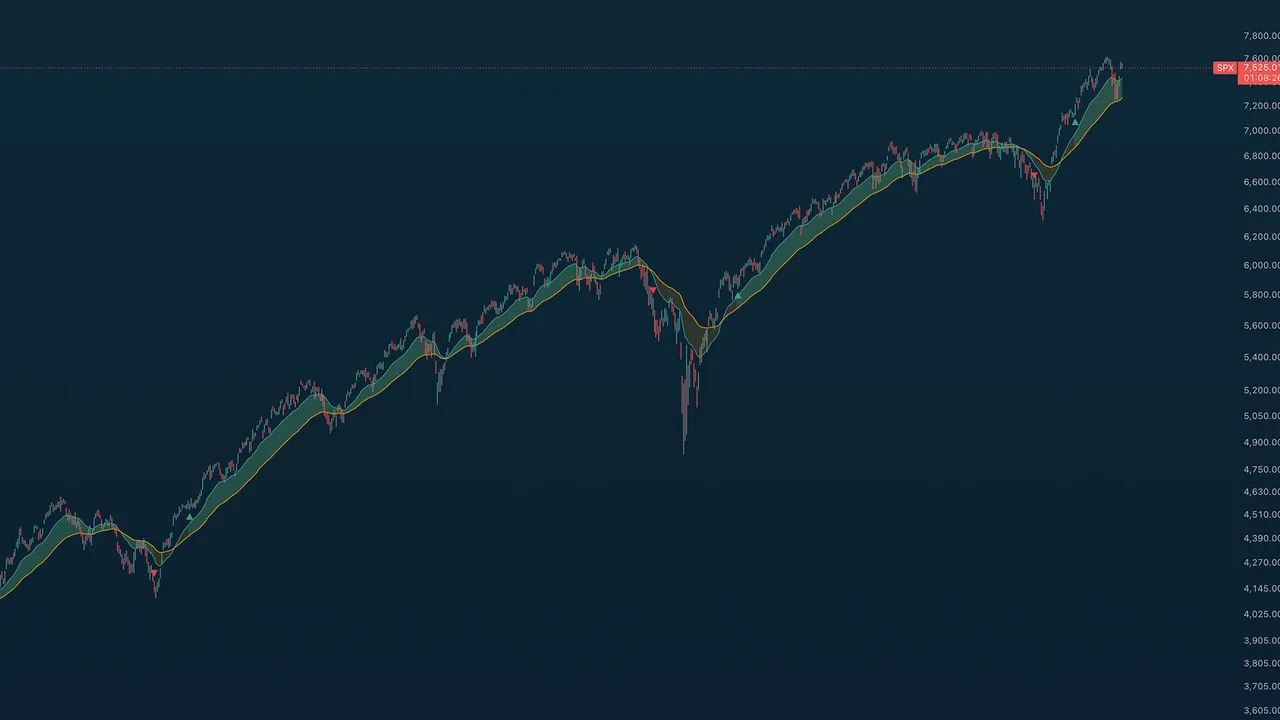
Skip to content

Your profile username — not your real name or email.

Must match your Patreon email so we can verify your membership.

The indicators

What You'll Get Access To

A suite of custom TradingView indicators built for clarity. Full guides live in the Community hub, or browse them all on TradingView ↗.

TA Confluence Bands

TA Confluence Bands

Quant

Core System · Confluence Clouds

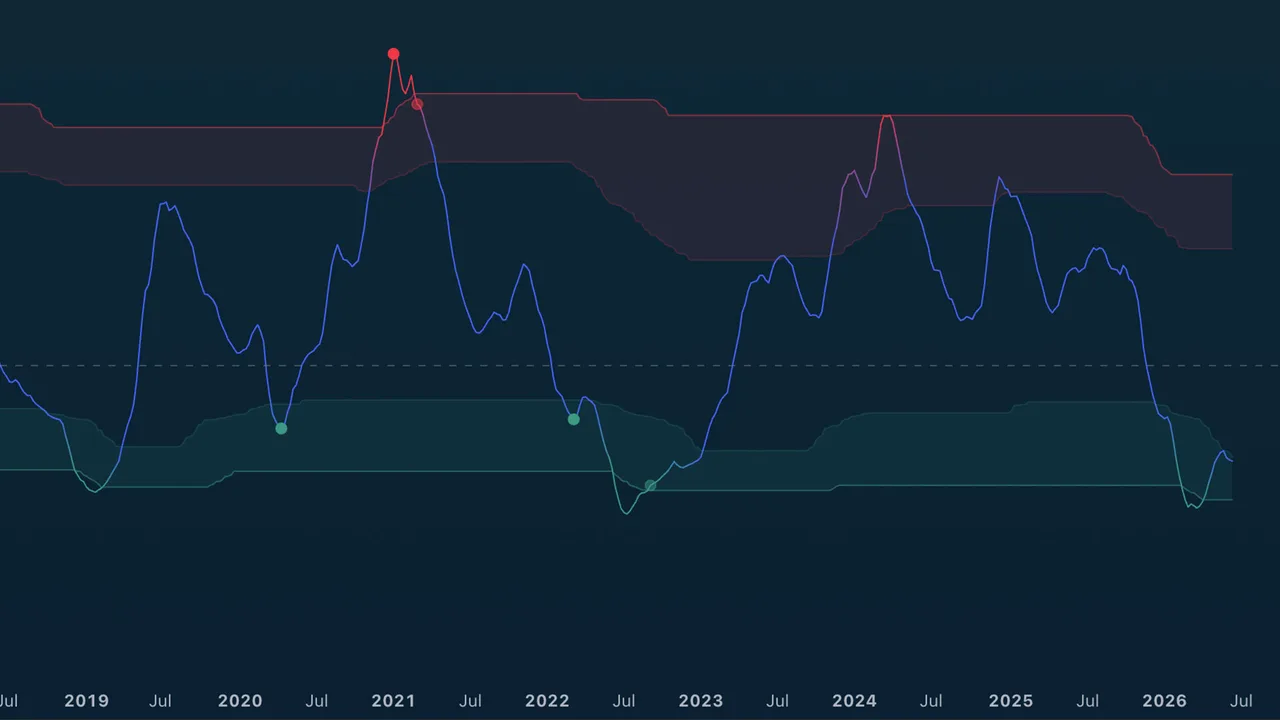
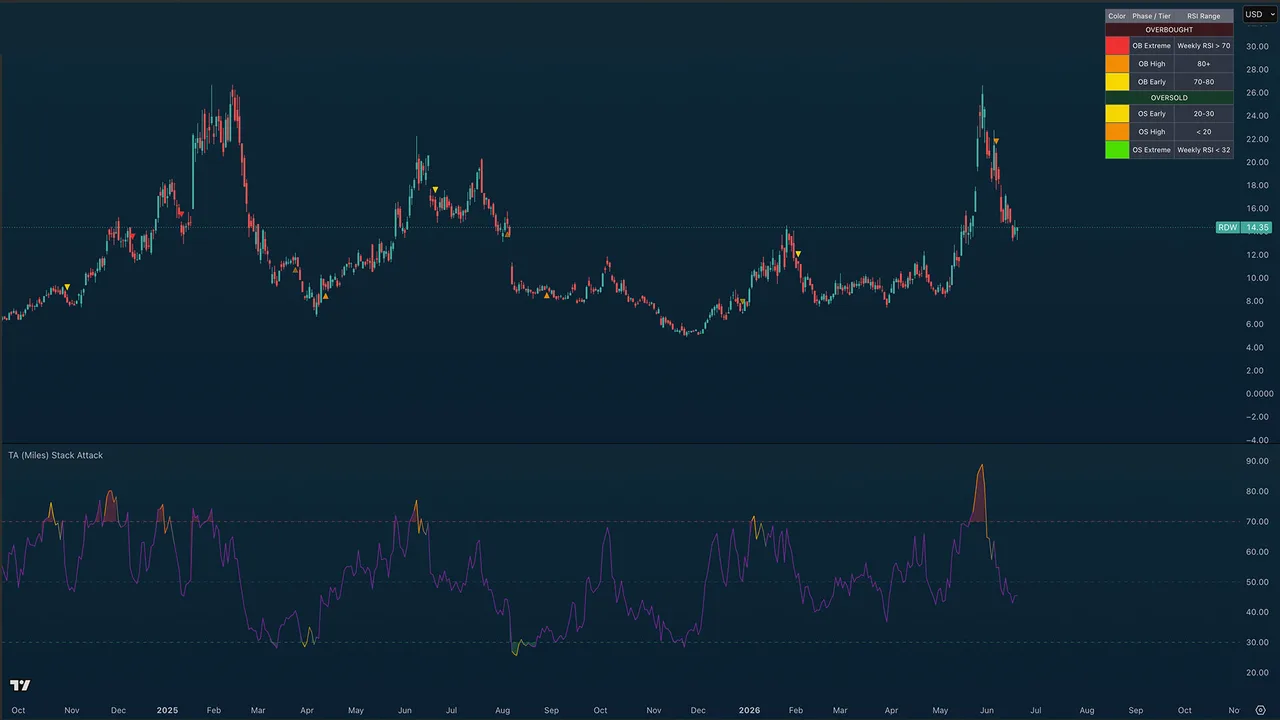
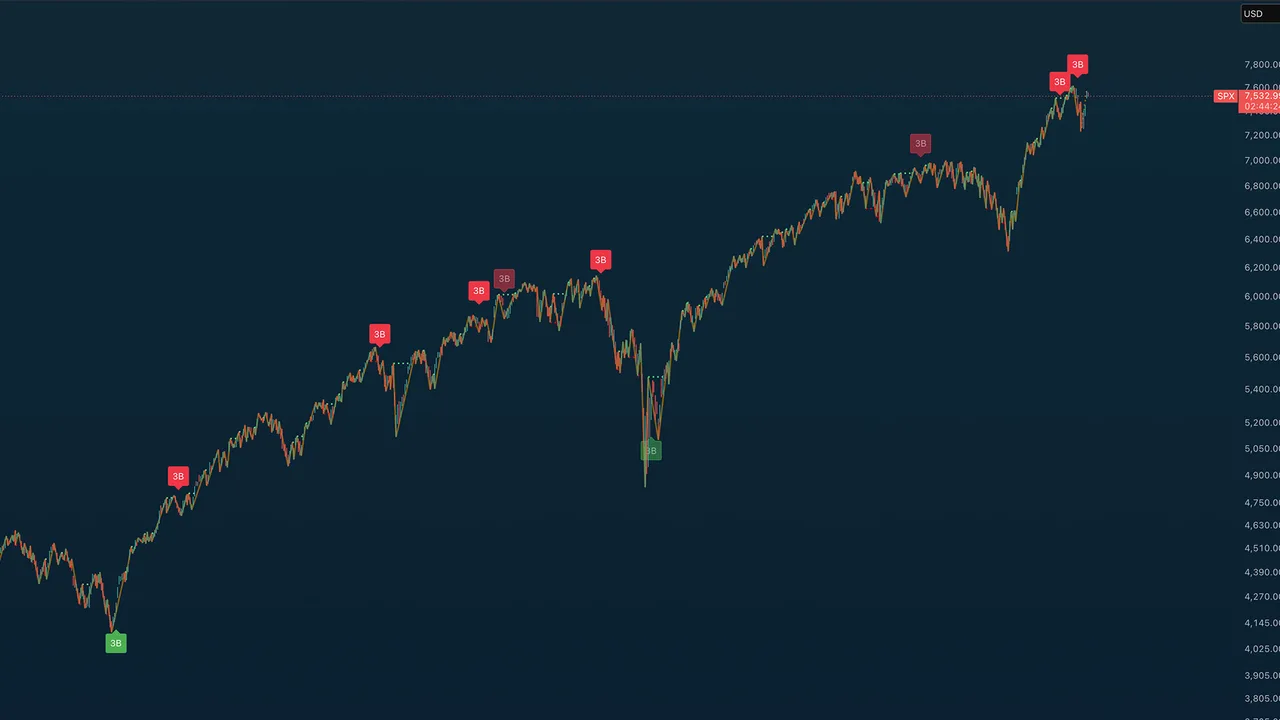
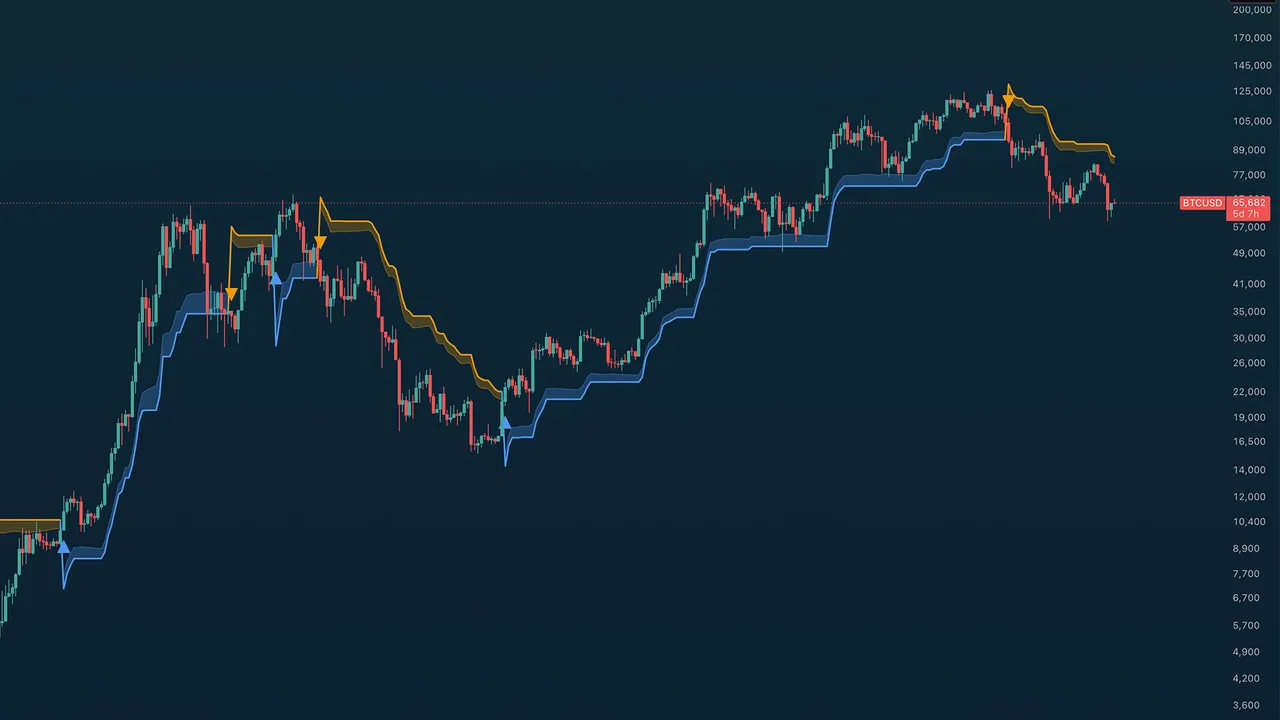
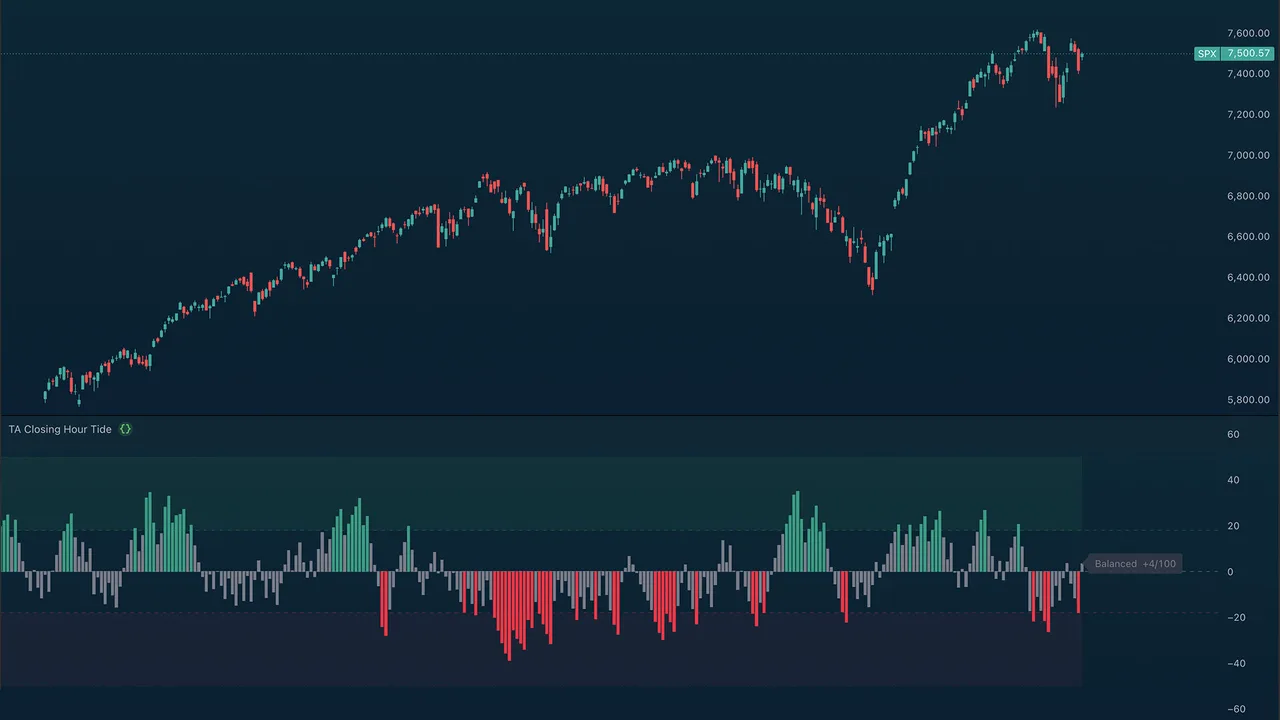
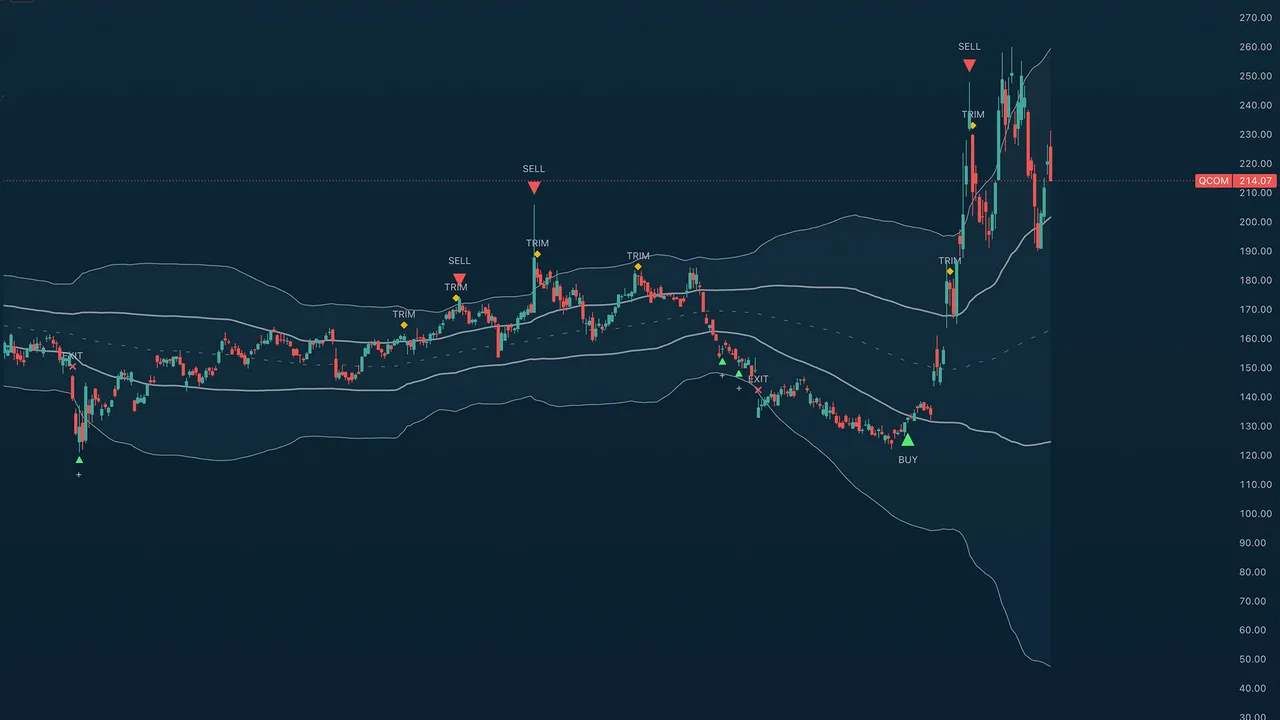
The heart of my trading system. Two adaptive clouds read the narrative of price action, and blended with Mean Reversion and Stack Attack RSI the confluence engine scores every bar and marks only the swings that matter.

View on TradingView ↗
TA Mean Reversion

TA Mean Reversion

Quant

Oscillators · Mean Reversion

Measures how stretched price is from its mean in standard deviations and walks the reversal through watch, setup, trigger, and confirm stages.

View on TradingView ↗
TA Stack Attack

TA Stack Attack

Quant

Oscillators · Momentum

A multi-timeframe RSI confluence engine that fires a three-phase signal when the 1H, 4H, daily, and weekly stack into agreement.

View on TradingView ↗
TA Gann Swing Indicator

TA Gann Swing Indicator

Trader & Quant

Trend · Swing Structure

W.D. Gann's swing methodology: confirmed swing structure, break-line projections, and a 3-bar reversal rule that flags high-conviction turns.

View on TradingView ↗
TA Trend Ribbon

TA Trend Ribbon

Trader & Quant

Trend · Volatility

A SuperTrend-based dynamic trend follower with ATR-adaptive stops and configurable directional bias for clean bull and bear regime identification.

View on TradingView ↗
TA Adaptive Trend

TA Adaptive Trend

Trader & Quant

Trend · Moving Averages

A volatility-gated 21/55 EMA trend follower whose flips only count when volume, volatility, and an anti-chop engine confirm the move.

View on TradingView ↗
TA Moving Averages

TA Moving Averages

All tiers

Moving Averages · Trend

Eight timeframe-anchored moving averages (20/50/100/200 day and week) plus five custom slots — each shows its true daily or weekly value on any chart timeframe.

View on TradingView ↗
TA Benner Chart

TA Benner Chart

All tiers

Cycles

Samuel Benner's 1875 commodity-cycle forecast rendered on your chart with projections through 2100 — panic (sell), peak (trim), and trough (buy) years.

View on TradingView ↗
TA Closing Hour Pulse

TA Closing Hour Pulse

All tiers

Institutional Flow

A cumulative "smart money" line read from the final hour of each session, with the companion Closing Hour Tide — divergence vs price flags hidden accumulation and distribution. Free for all tiers.

View on TradingView ↗
TA Closing Hour Tide

TA Closing Hour Tide

All tiers

Institutional Flow

The companion to Closing Hour Pulse — a banded read of closing-hour institutional flow that flags accumulation and distribution extremes against price. Free for all tiers.

View on TradingView ↗