
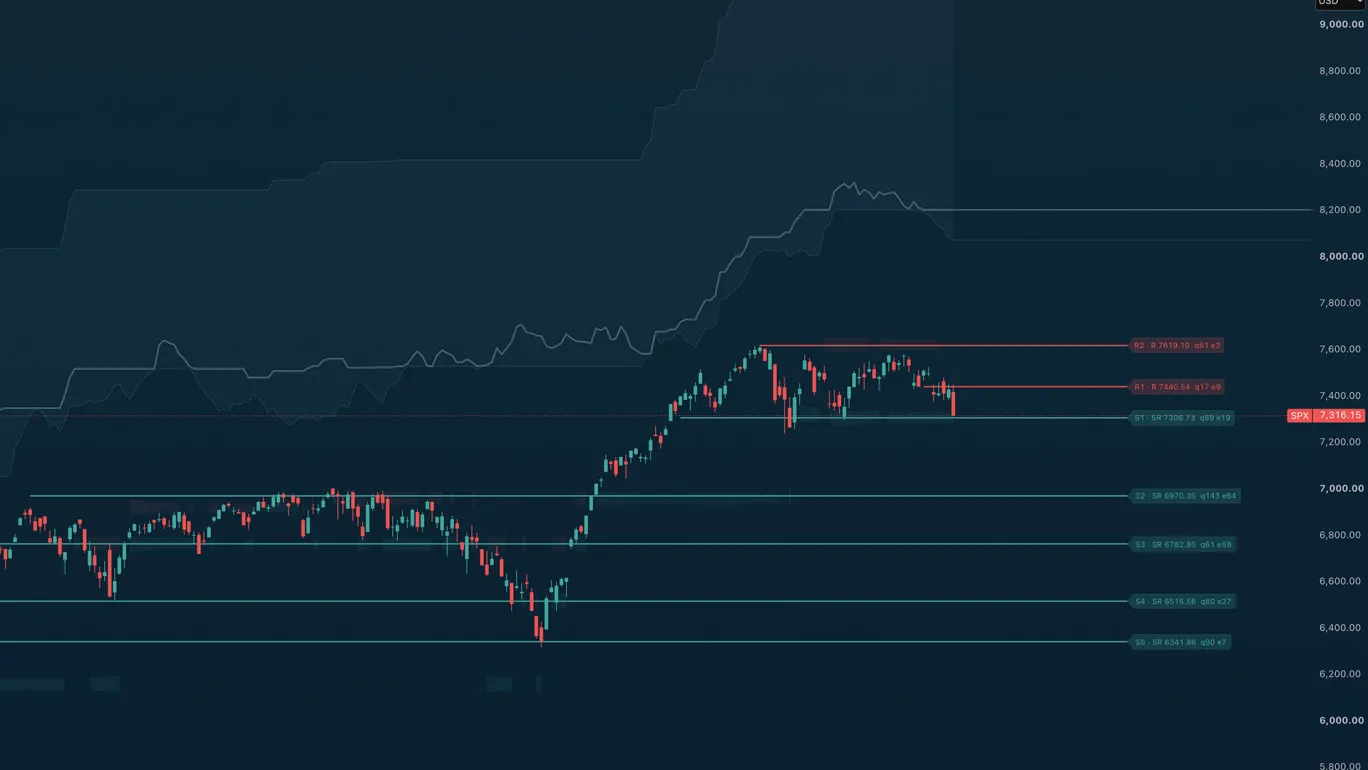
Support and resistance the market has actually proven. Adaptive Levels finds confirmed pivots on the Weekly, Daily, 4H, and 1H, merges them into one shared pool, and scores each level by how price has respected it over time. Bounces build a level's strength; breaks decay it; only levels that earn their place get drawn. Because levels are built from fixed higher-timeframe data, the picture is identical on every chart timeframe, and it never repaints: a pivot only becomes a level after its higher-timeframe candle closes.
What you see on the chart
- Green (teal) lines: support at or below the current reference price. Red lines: resistance above it. Line opacity reflects strength.
- Labels on the right edge: role prefix (S support / R resistance / SR both), price, and optional stats: quality score, event count, and the bounce/rejection/break/failure breakdown.
- ATR zones (optional): shaded reaction bands on the nearest support and nearest resistance, sized by 4H ATR so they breathe with volatility.
- A Next-ATH scenario: a forward-looking gray-blue band with a dashed median line, blending up to three independent estimates (Fibonacci extension, measured move, and volatility projection) of where the next all-time high might land. A planning overlay, not a trade signal.
- A dashboard (top right): active tiers, filters, visible line counts, nearest S/R, and the ATH readout.
How levels are built
Anchor date → pivot detection per timeframe → confirmation delay (no repainting) → clustering of nearby pivots → scoring from touches, bounces, rejections, breaks, and failures → promotion once a level has earned enough evidence → a visibility cap that shows only the closest N levels below and above price. Confluence bonuses reward levels that align with Fibonacci retracements and round numbers.
How to read it
Quality tiers run confirmed → strong → elite; the strength filter lets you show all confirmed levels or only the strong/elite ones. Trade level to level: stretched price arriving into an elite support with a reversal signal from Deviation Bands or Adaptive Mean Reversion is the setup this suite is built around. Use it on 4H, 1H, or 15m charts; above 4H the 4H tier degrades and the dashboard warns you.
Key settings
Timeframe tiers on/off, a level timeframe view (show only levels born on a chosen tier, e.g. Daily levels on a 4H chart), strength and quality filters, independent counts of support/resistance lines shown, label detail (price only → full stats), ATR zone width, and the full Next-ATH projection block.
Alerts
8 alert types, including level touched (any/support/resistance, with an ATR-scaled touch tolerance), level crossed (any/up/down), new ATH, and Next-ATH median reached.
TA Adaptive Levels is a Trading Apologist TradingView indicator.Request access to the scripts, or browseevery guide.
Educational and analysis purposes only. Not financial advice. See theterms.