
Guides
Indicator Guides
How every Trading Apologist indicator works, what each marker means, and how to set it up: the TradingView suite and the AI Trading Desk chart indicators.
See it work
The AI Trading Desk
Where the indicators below are drawn, and what a read of them looks like end to end.
TradingView
TradingView Indicators
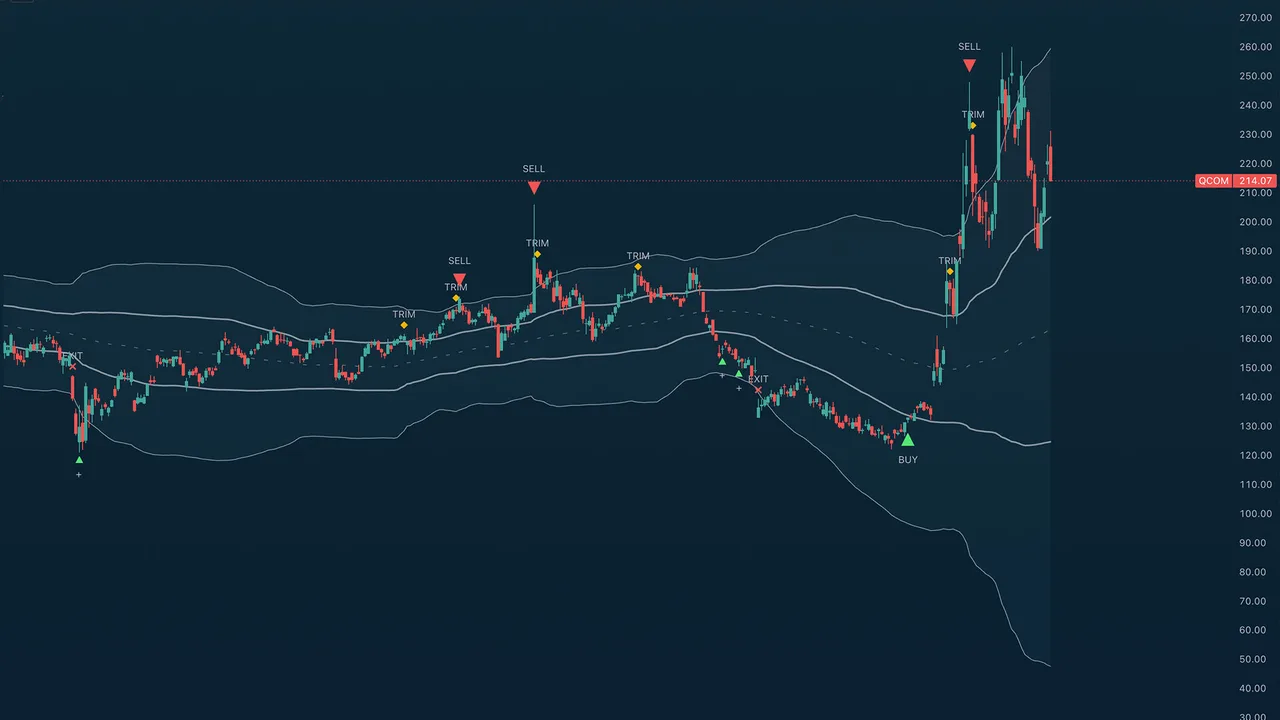
Deviation Bands
Adaptive bands that show when price is overstretched, with staged BUY / ADD / TRIM / SELL markers that tell you what to do about it.
Read the guide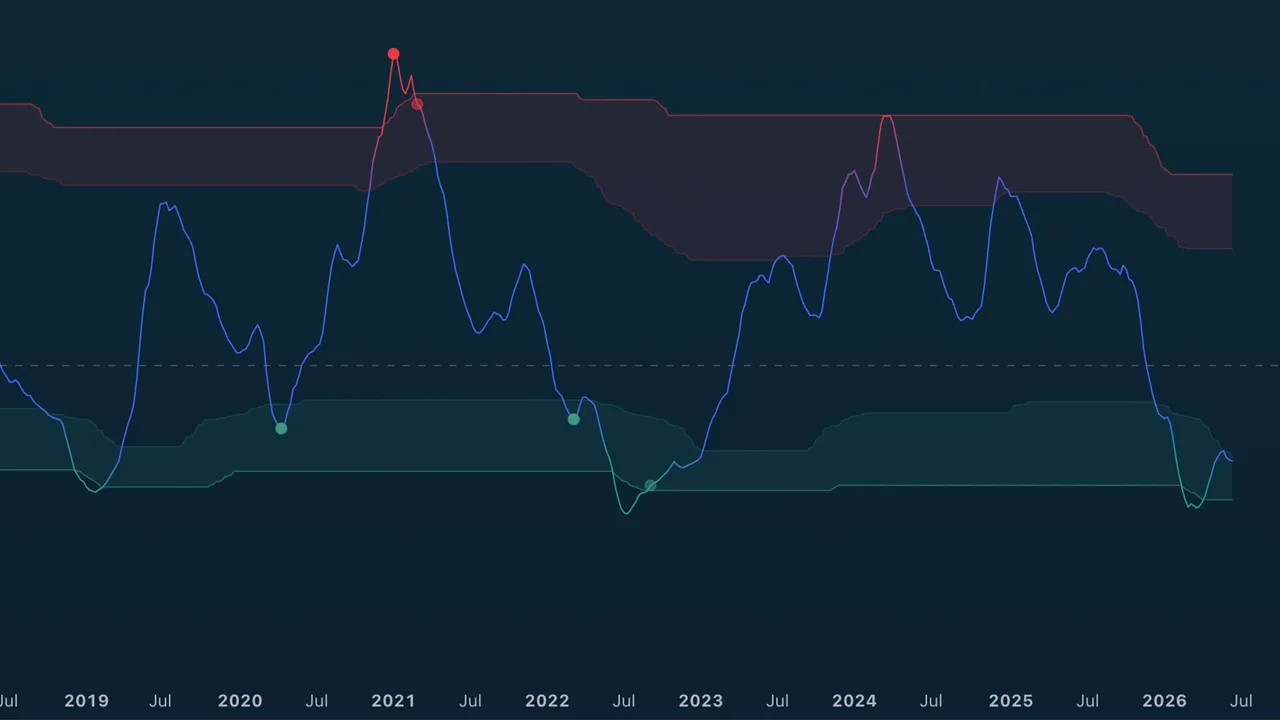
TA Adaptive Mean Reversion
Measures how overstretched a move is and walks you through the reversal in four stages: Watch → Setup → Trigger → Confirm.
Read the guide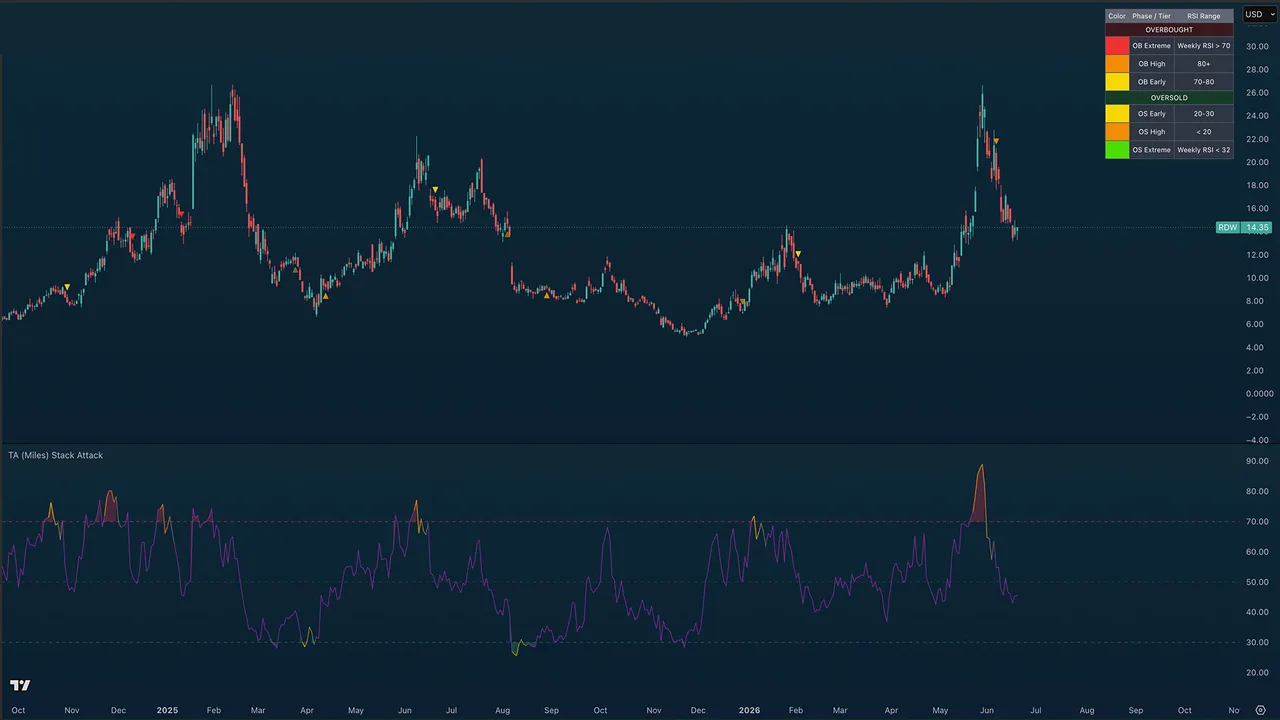
TA Stack Attack RSI
Watches RSI on the hourly, 4-hour, daily, and weekly at once, and fires a three-phase signal when they all reach extremes together.
Read the guide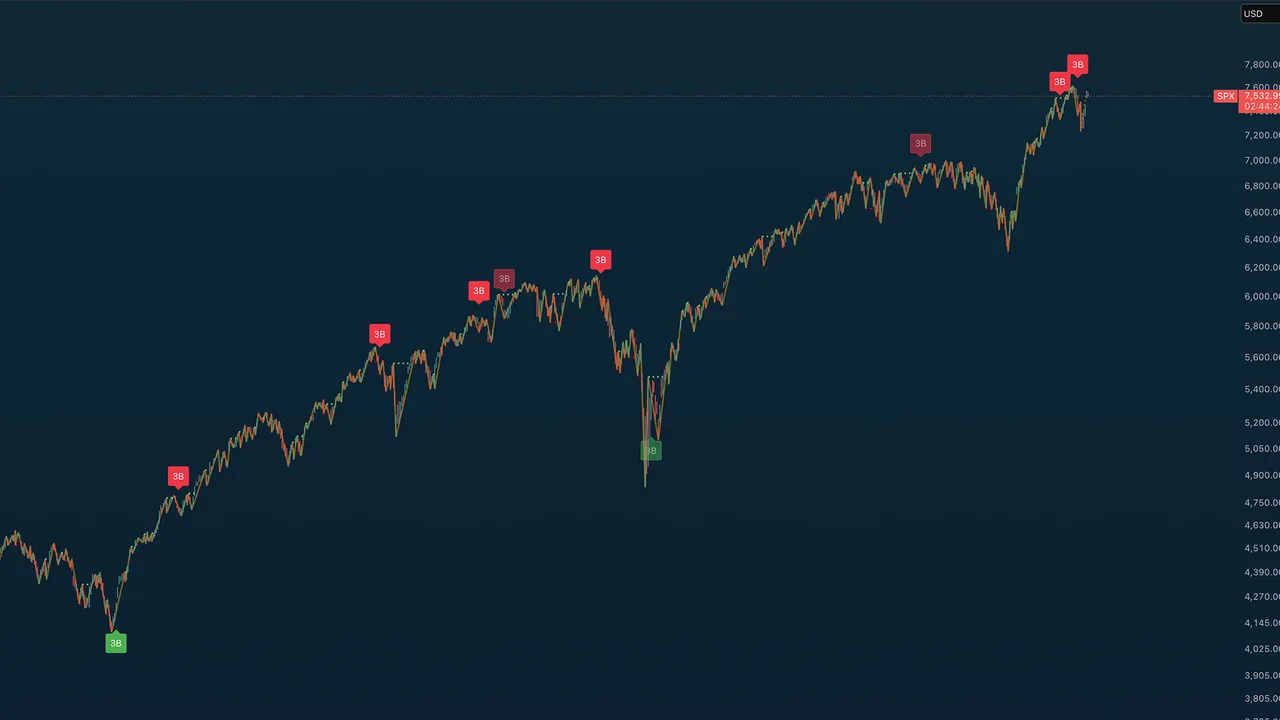
TA Gann Swing Indicator
Draws the market's swing structure for you: W.D. Gann's swing highs and lows, break-line projections, and a 3-bar reversal rule.
Read the guide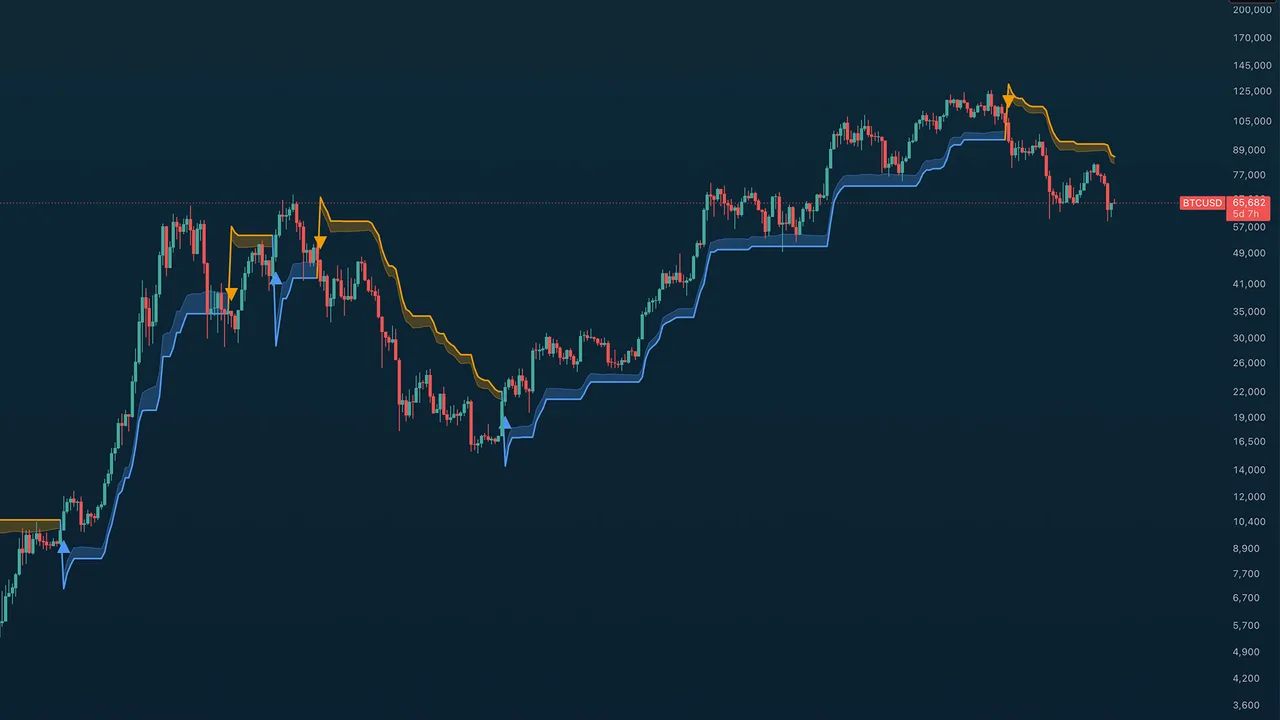
TA Trend Ribbon
A color-coded ribbon that answers one question at a glance: is this market in an uptrend or a downtrend right now?
Read the guide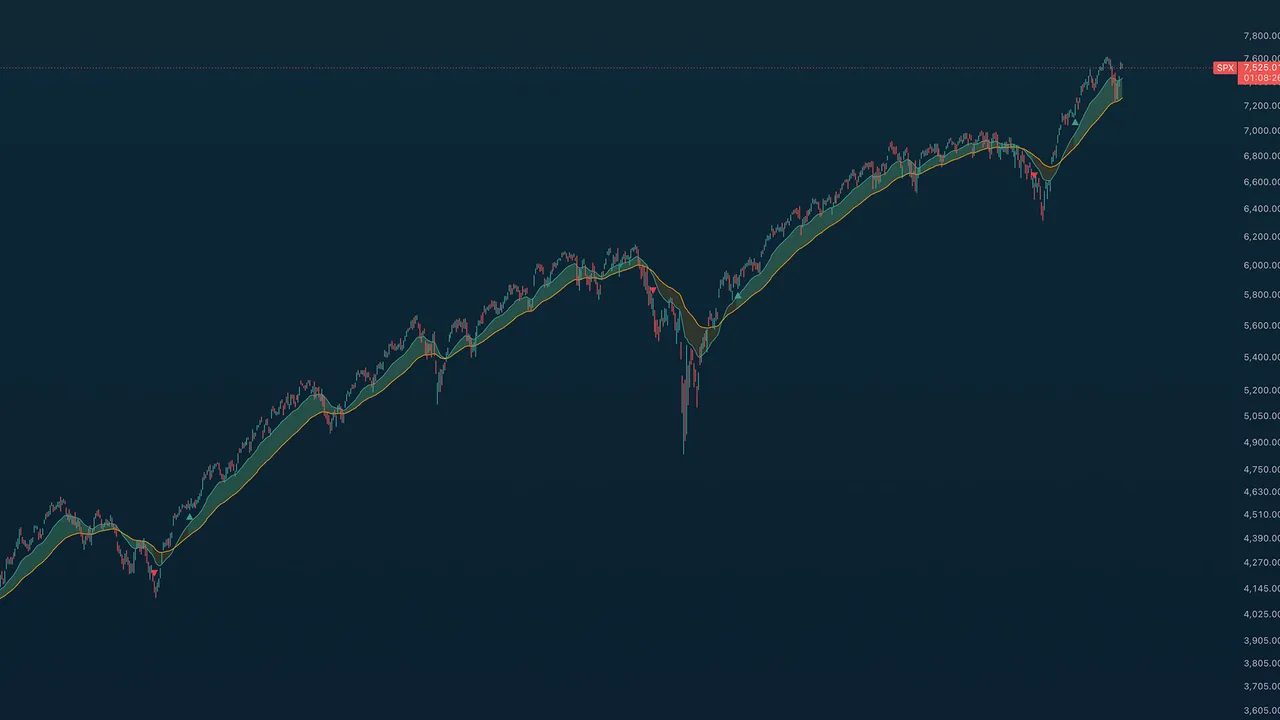
TA Adaptive Trend
A trend signal that scores momentum, volume, and divergence together, so choppy markets don't fake it out.
Read the guide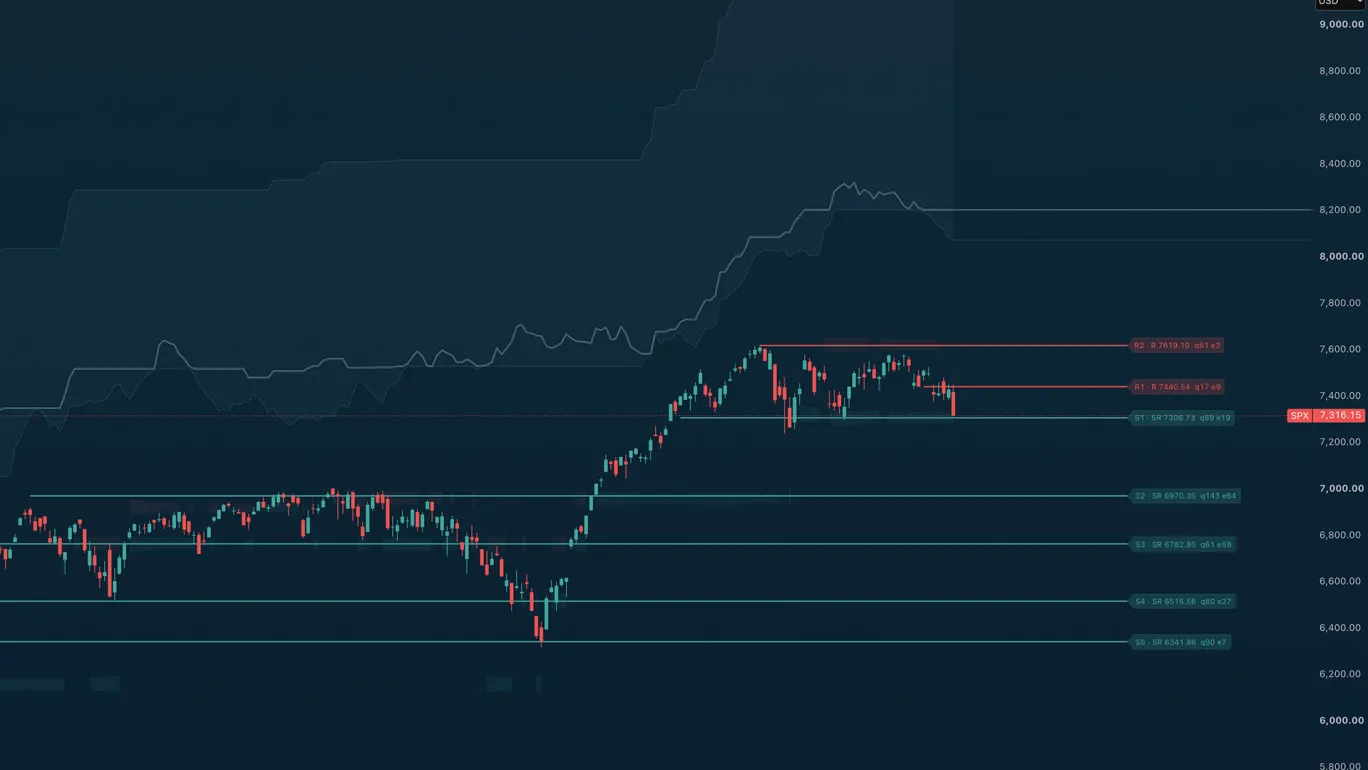
TA Adaptive Levels
Support and resistance the market has actually proven: confirmed pivots from four timeframes, scored by how price respects them, identical on every chart.
Read the guide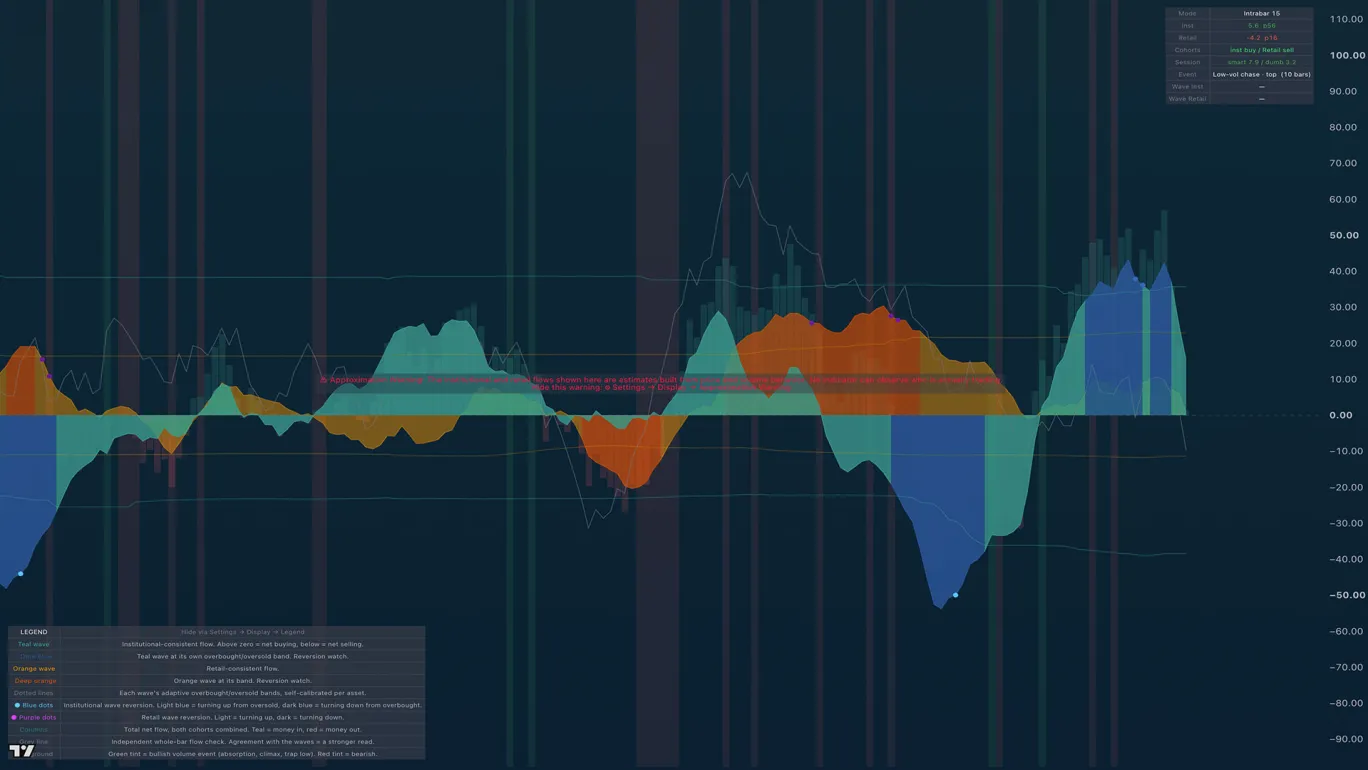
TA Money Flow
Splits every bar's volume into institutional-consistent and retail-consistent flow, and shows when either side is exhausted.
Read the guide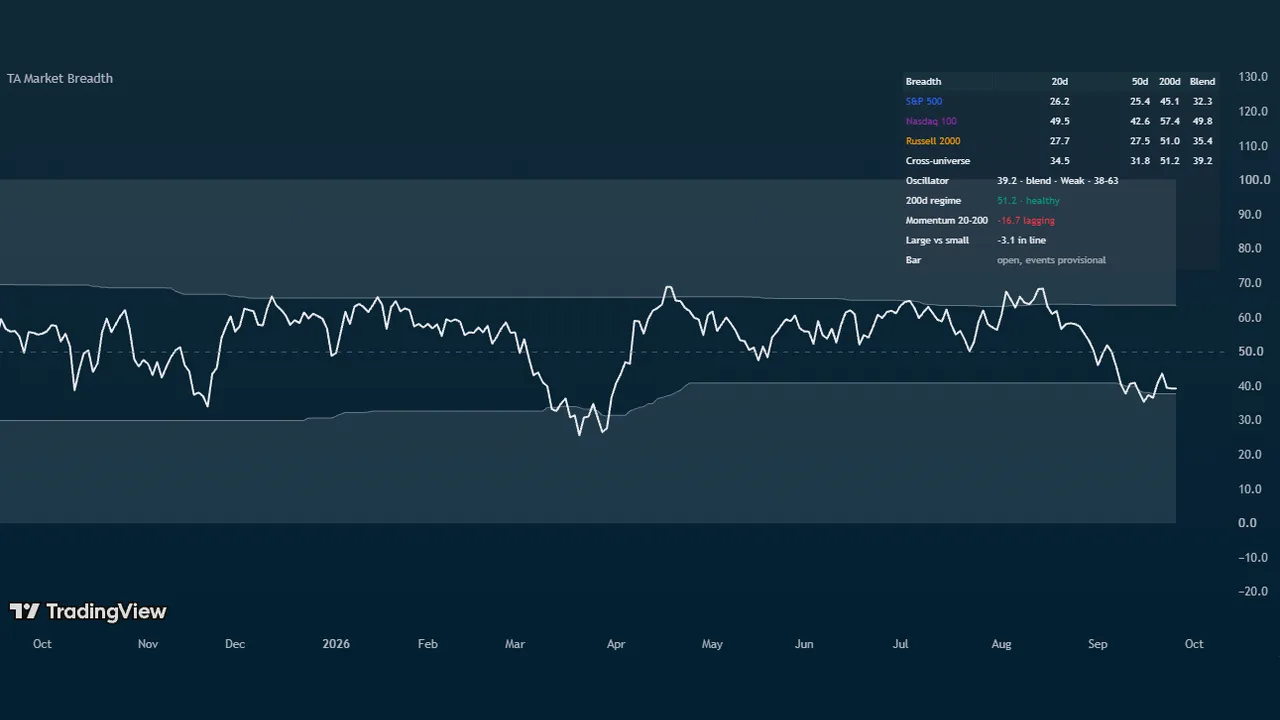
TA Market Breadth
Shows how many stocks are actually participating in a move, and whether that number is at an extreme worth acting on. Reads the same under any symbol.
Read the guide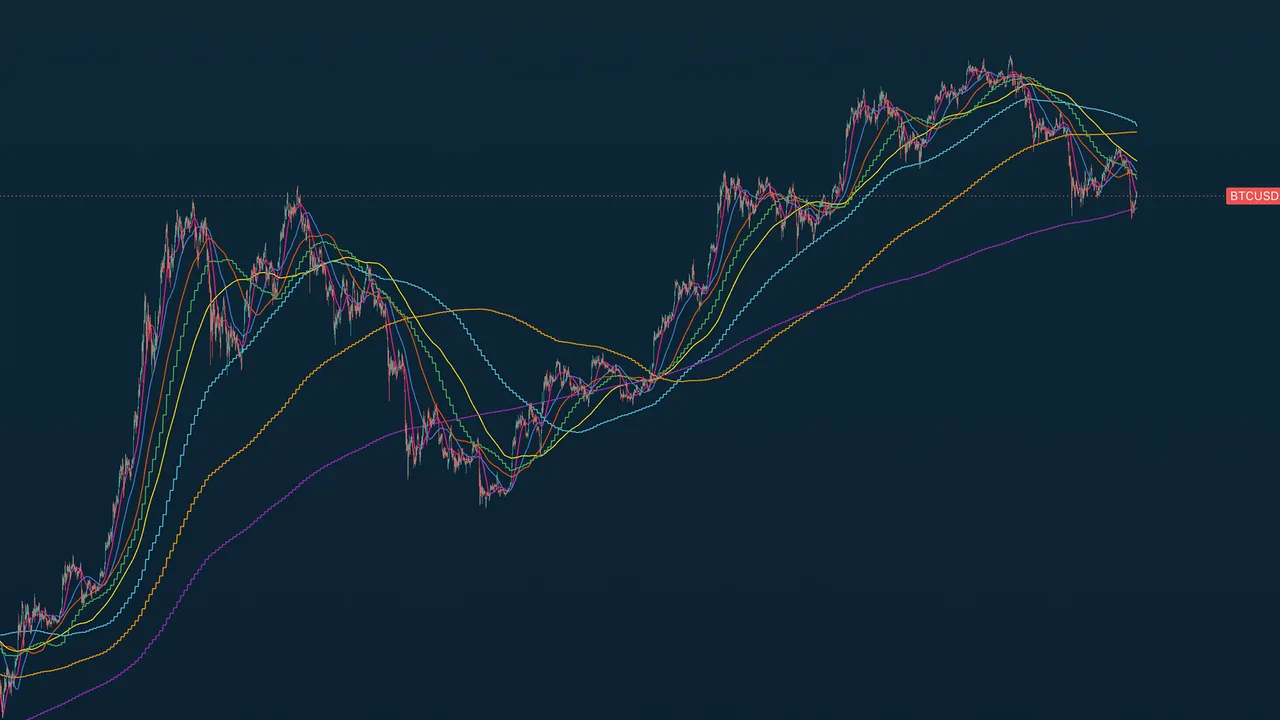
TA Moving Averages
Eight timeframe-anchored moving averages plus five custom slots, each true to its daily or weekly value on any chart.
Read the guide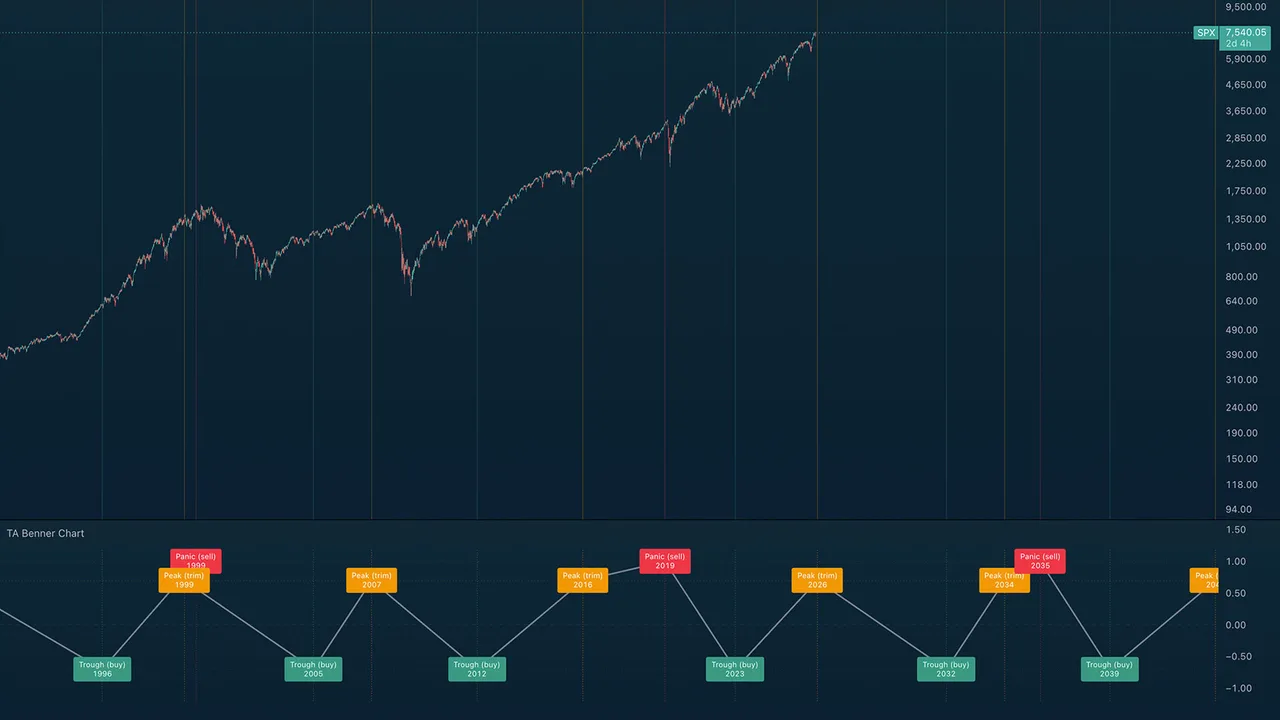
TA Benner Chart
Samuel Benner's 1875 commodity-cycle forecast projected onto your chart: panic, peak, and trough years.
Read the guide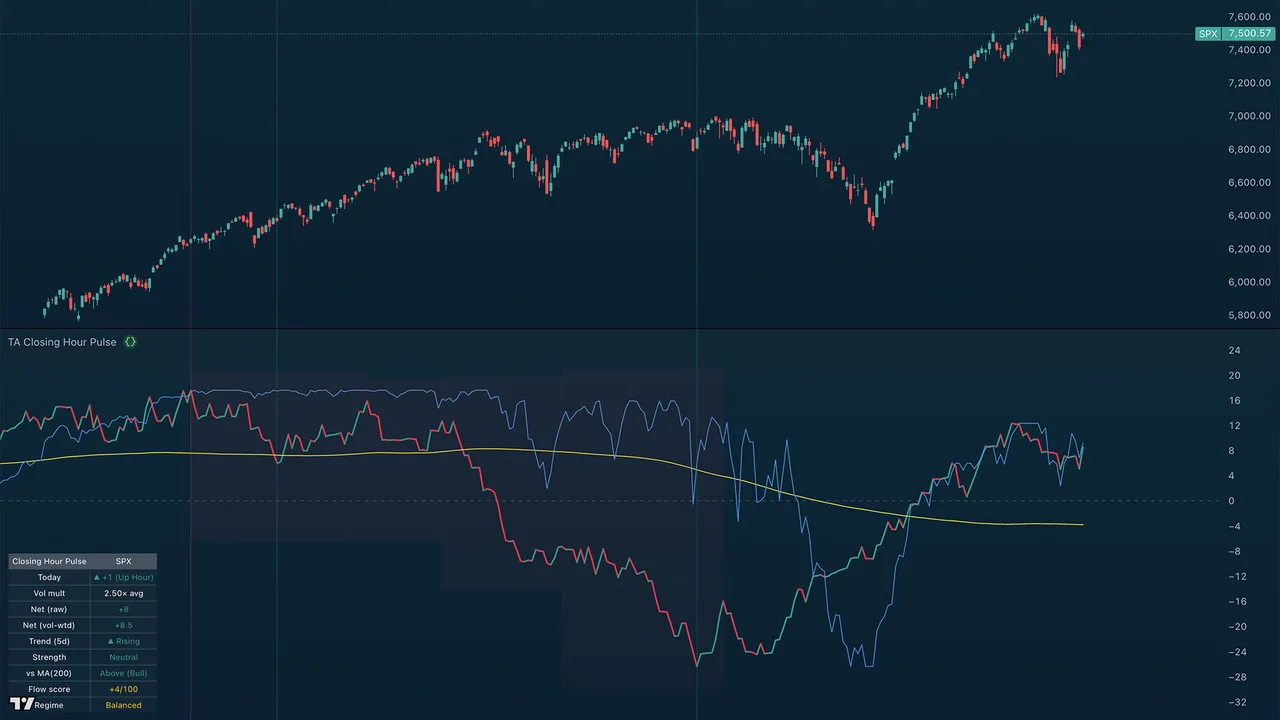
TA Closing Hour Pulse & Tide
Institutional flow read from the final hour of each session: a smart-money line vs price, with the companion Closing Hour Tide. Free for all tiers.
Read the guideAI Trading Desk
Trading Desk Guides
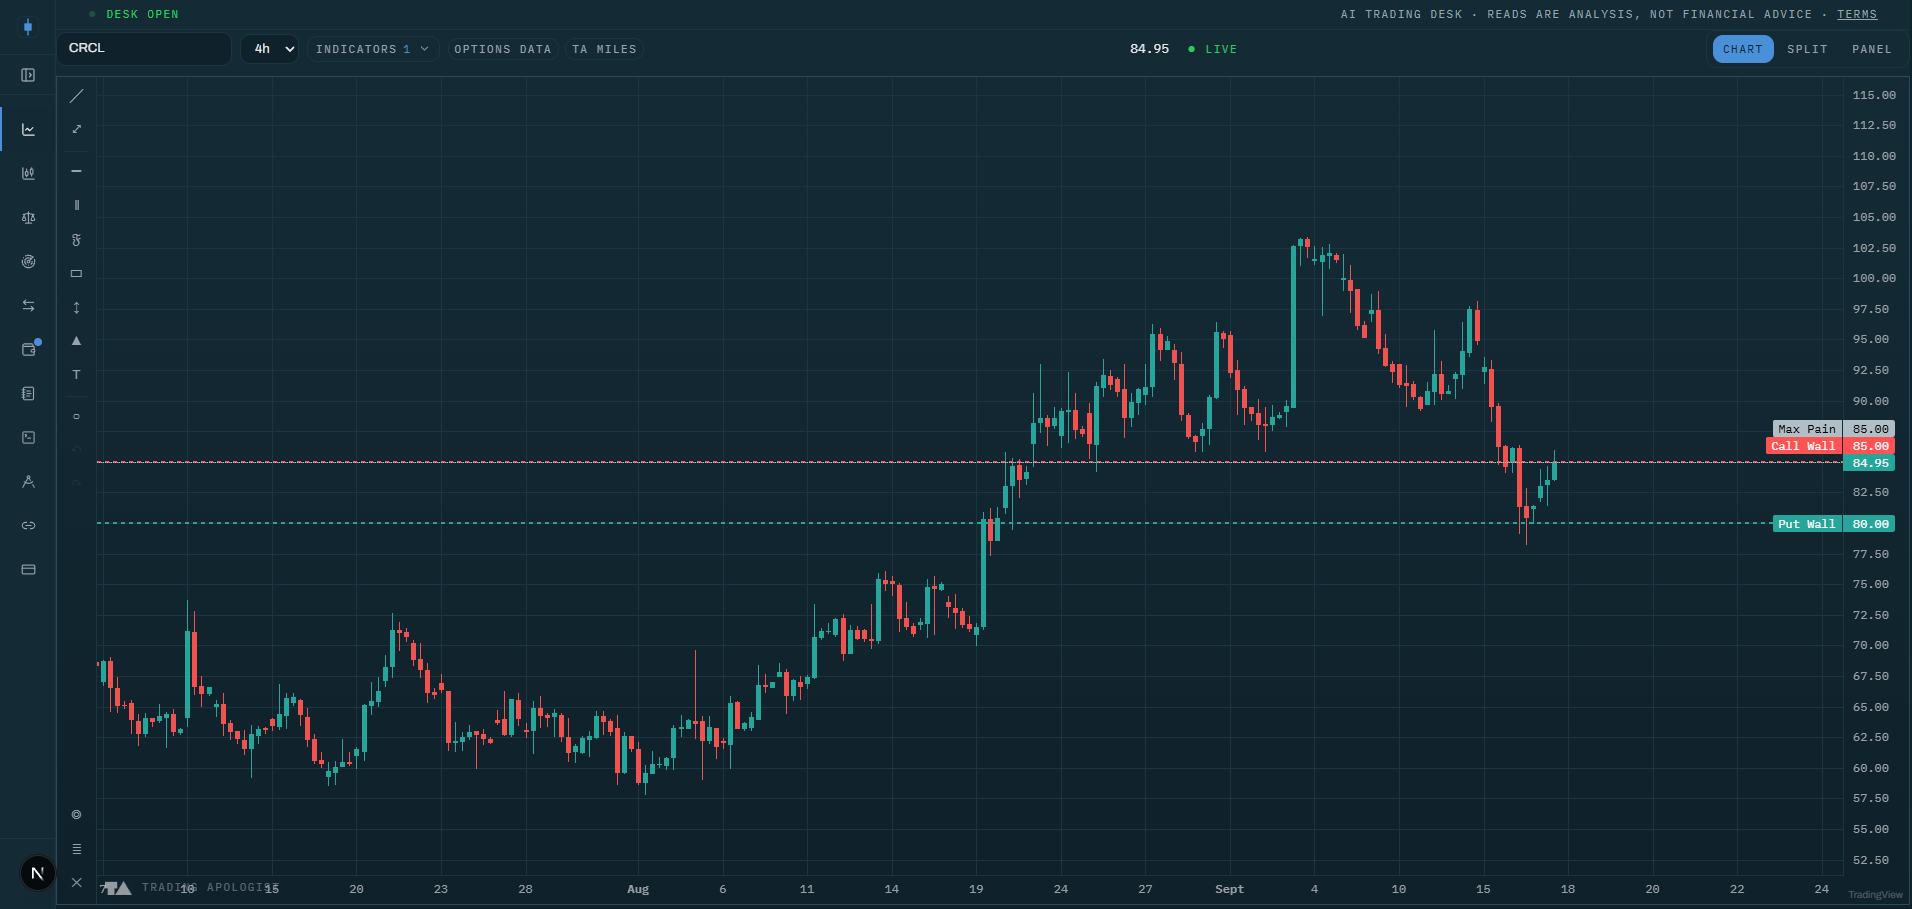
Option Walls
Call wall, put wall, gamma flip, and max pain on the price chart, with line weight showing how heavy each wall really is.
Read the guide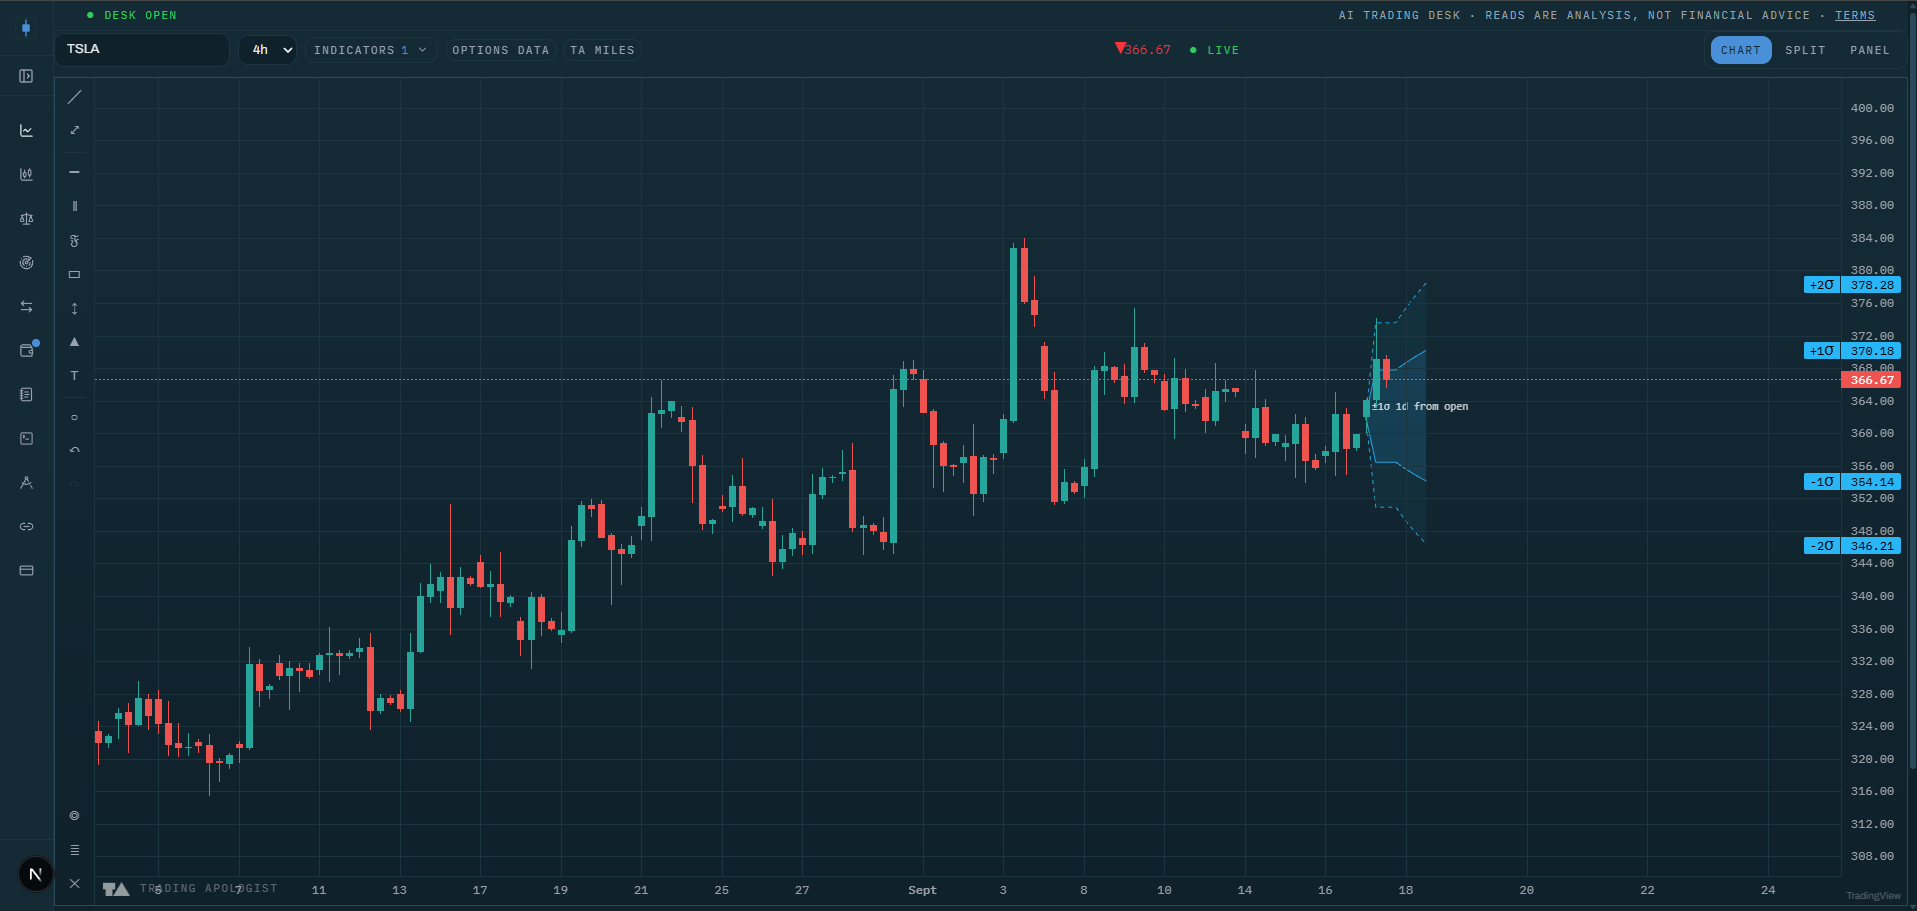
Expected Move Cone
The options-implied price range projected forward as a shaded cone, so you can see whether a target is a normal move or an unpriced one.
Read the guide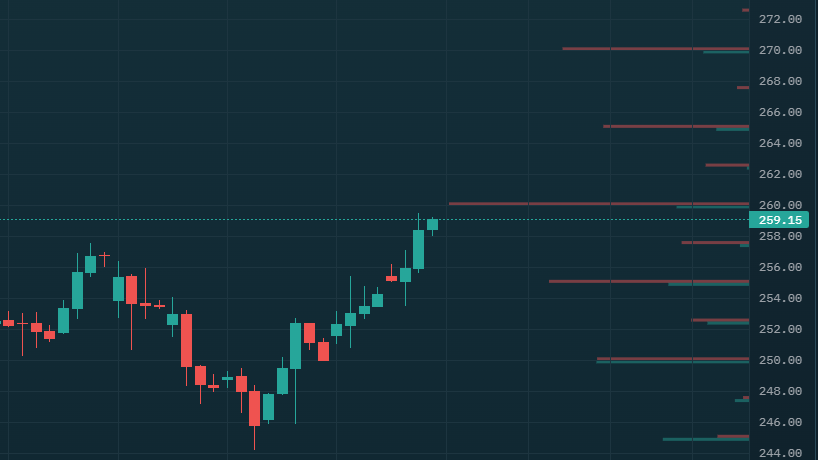
GEX Profile
The full gamma-exposure ladder by strike, the positive/negative gamma regime, and validity-corrected walls.
Read the guide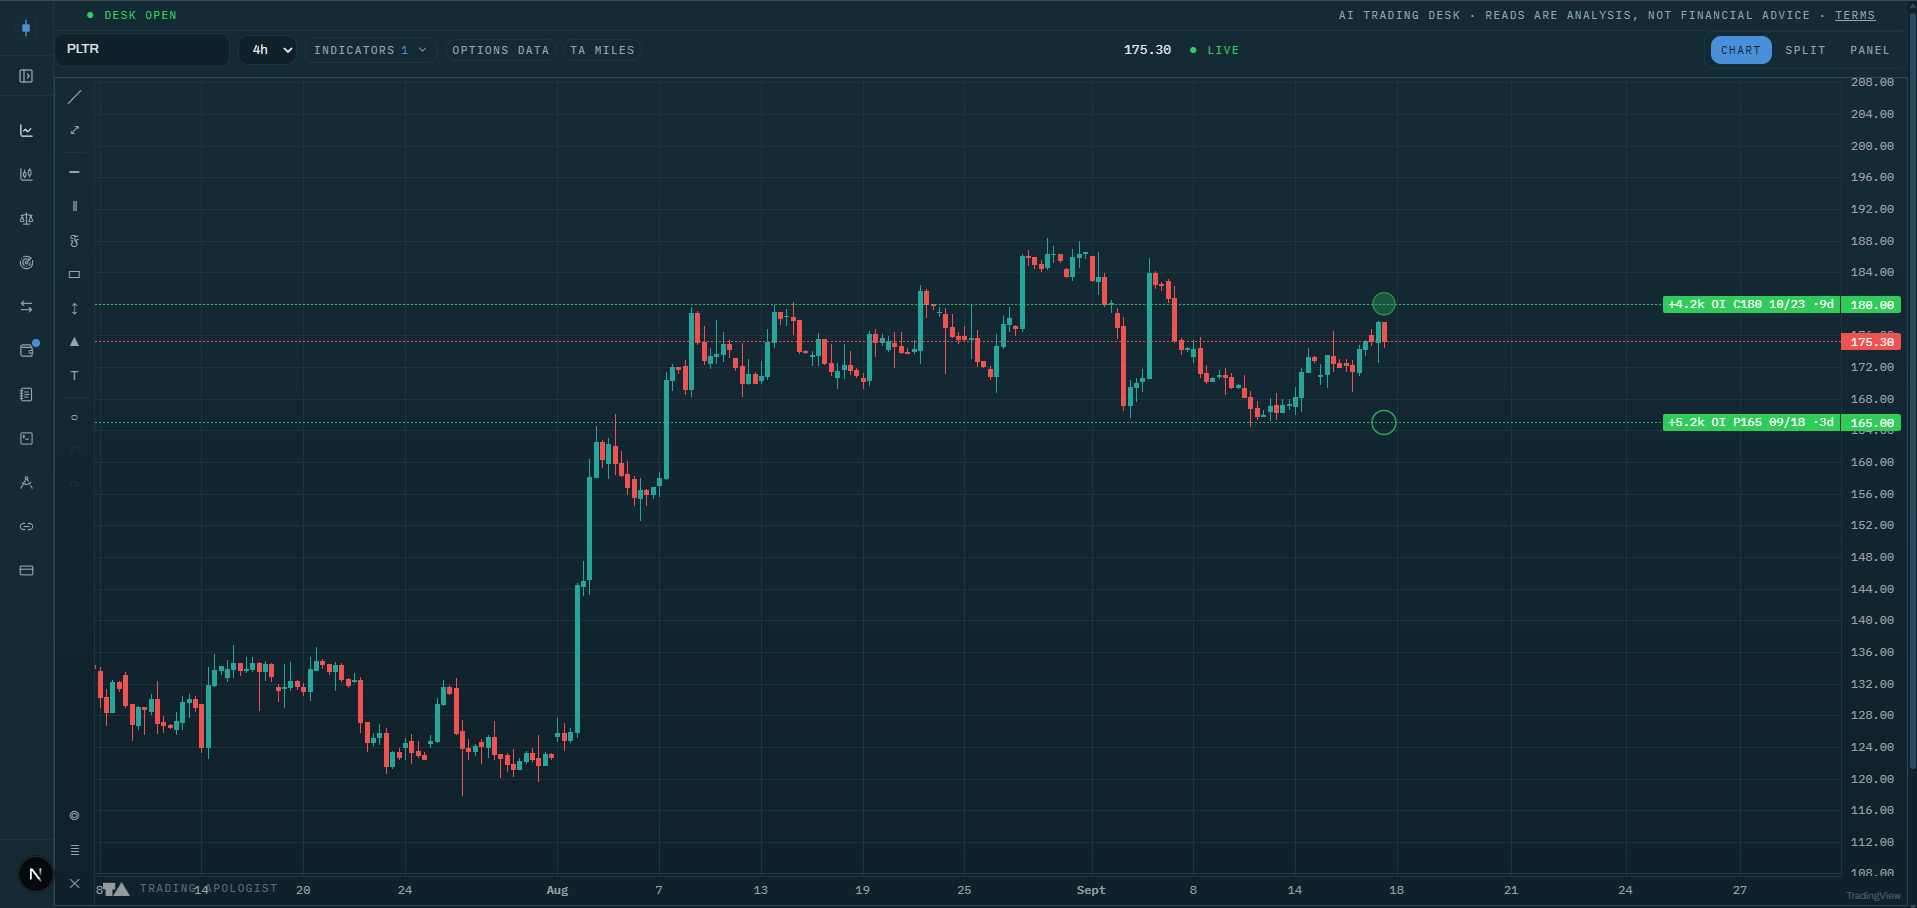
OI Change
Strikes where open interest built or unwound overnight: walls forming a day before they show up as gamma.
Read the guide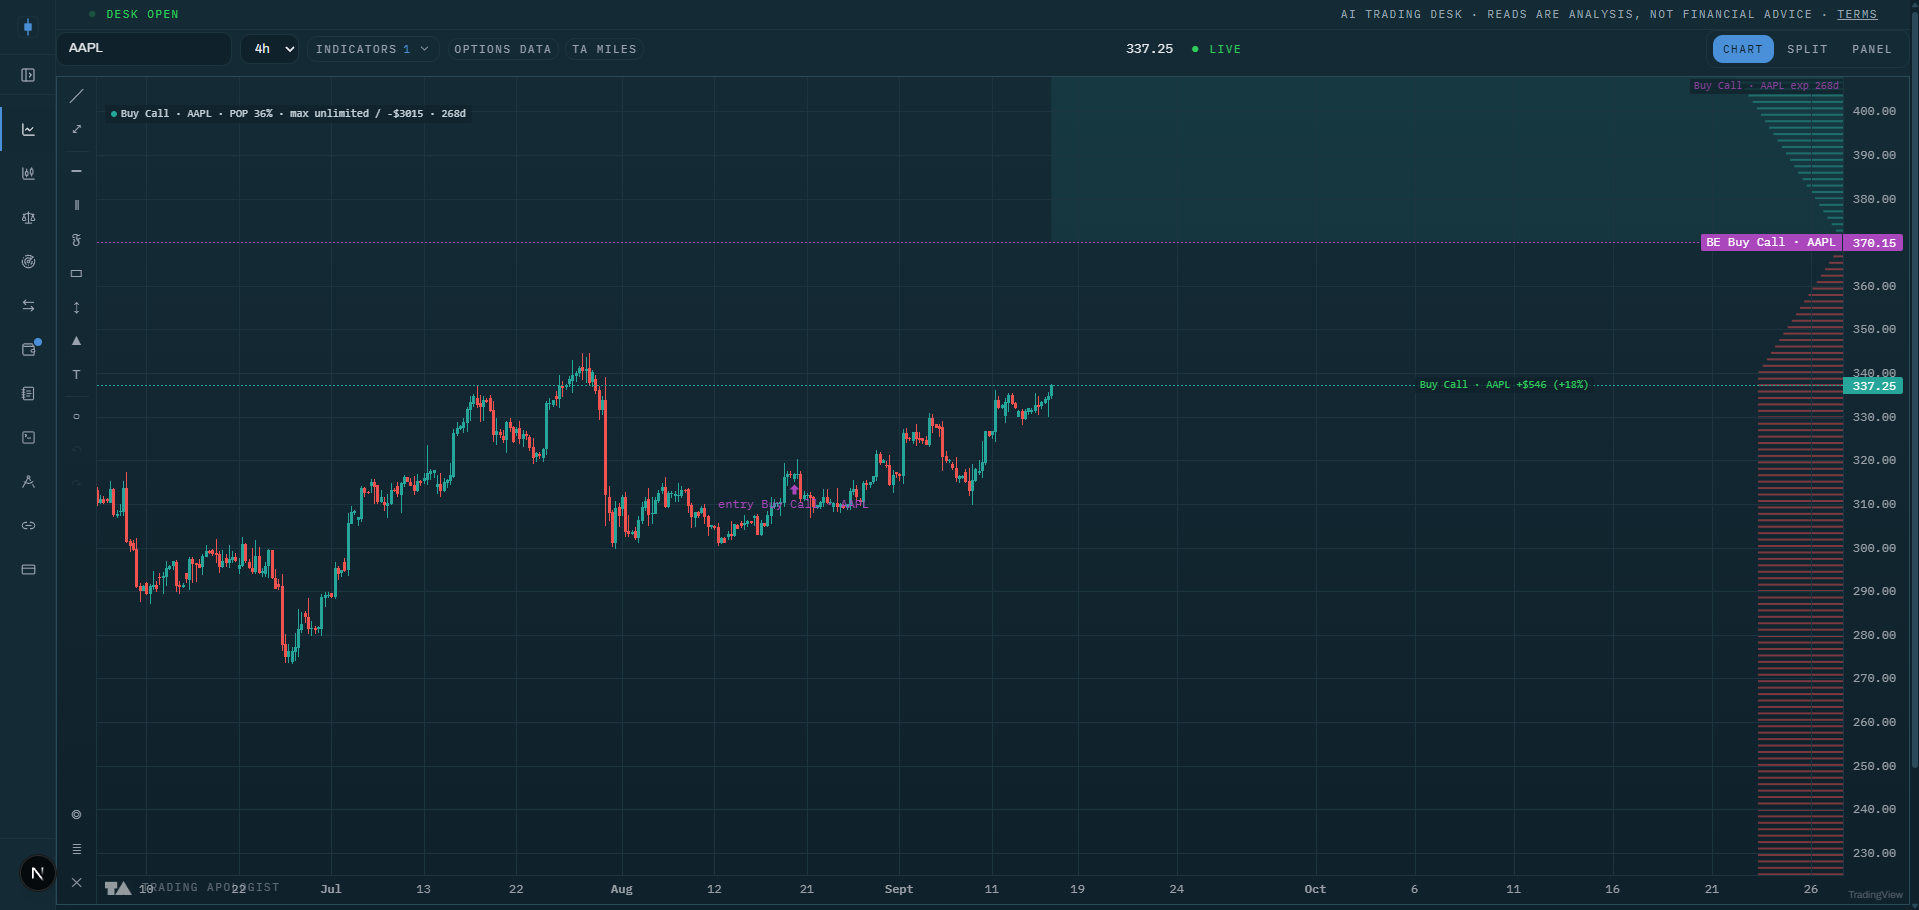
My Positions
Your saved Position Designer structures drawn on the chart: breakevens, profit zones, POP, and a live modeled P&L.
Read the guide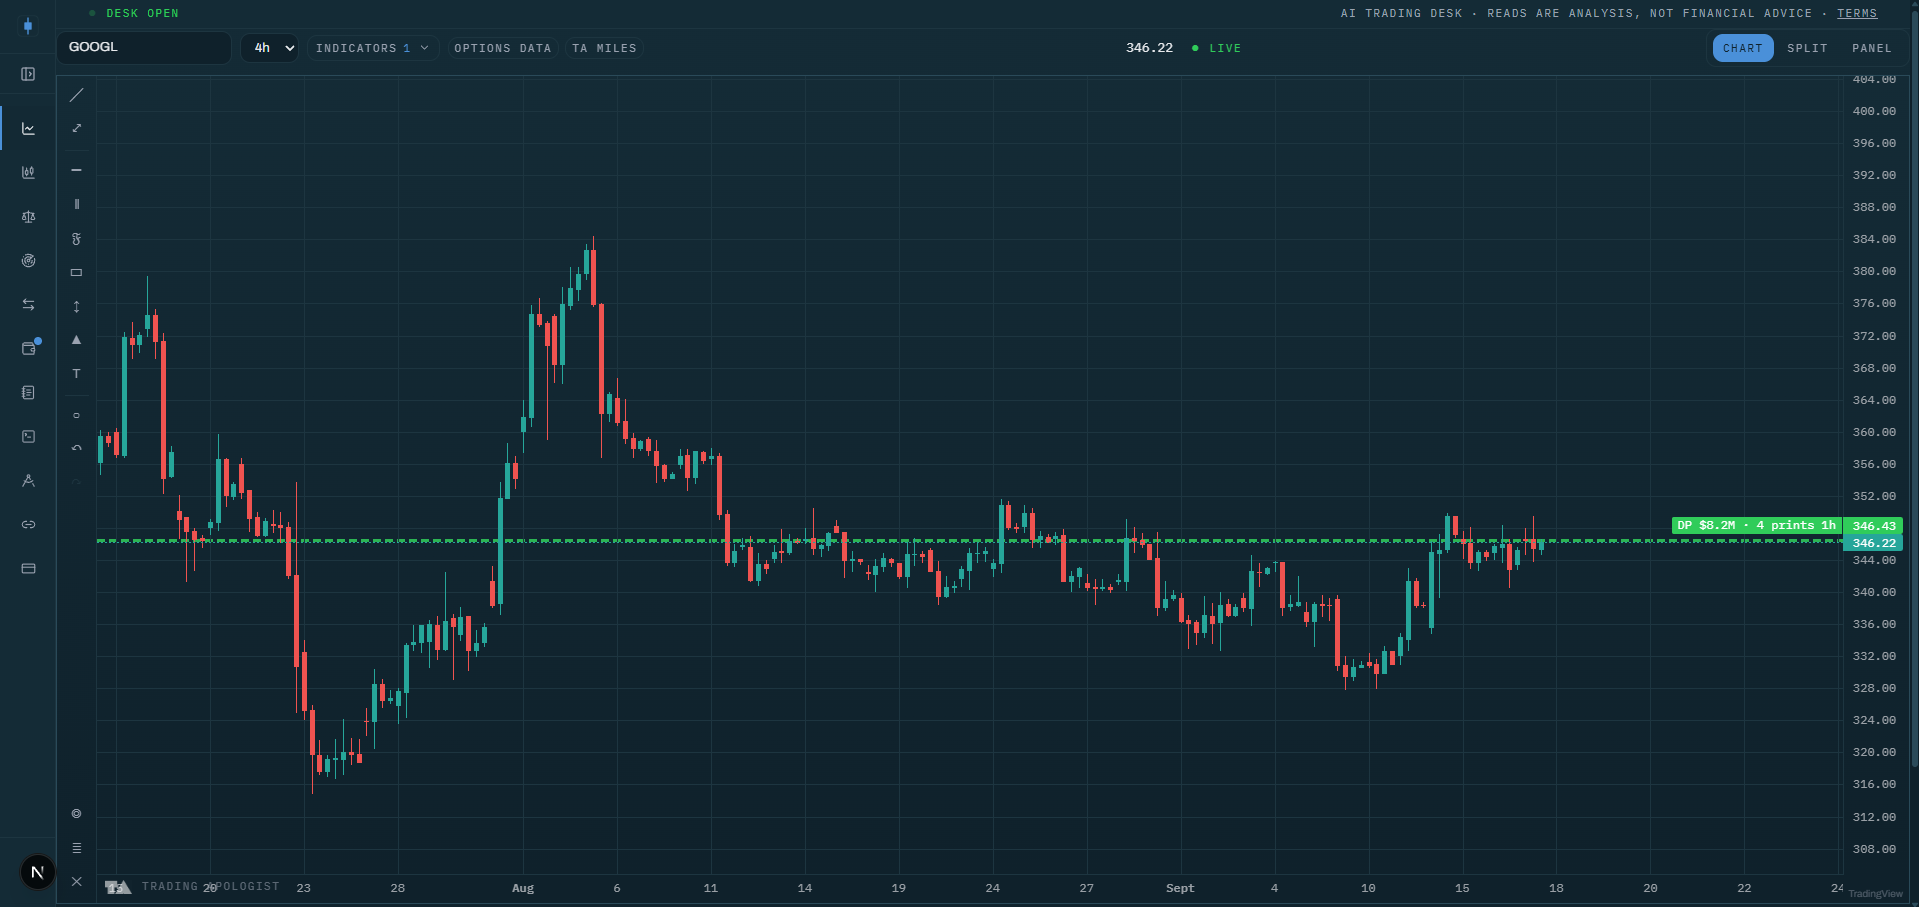
Dark Pool Levels
Off-exchange block prints clustered into price levels, weighted by notional and fading as they age.
Read the guide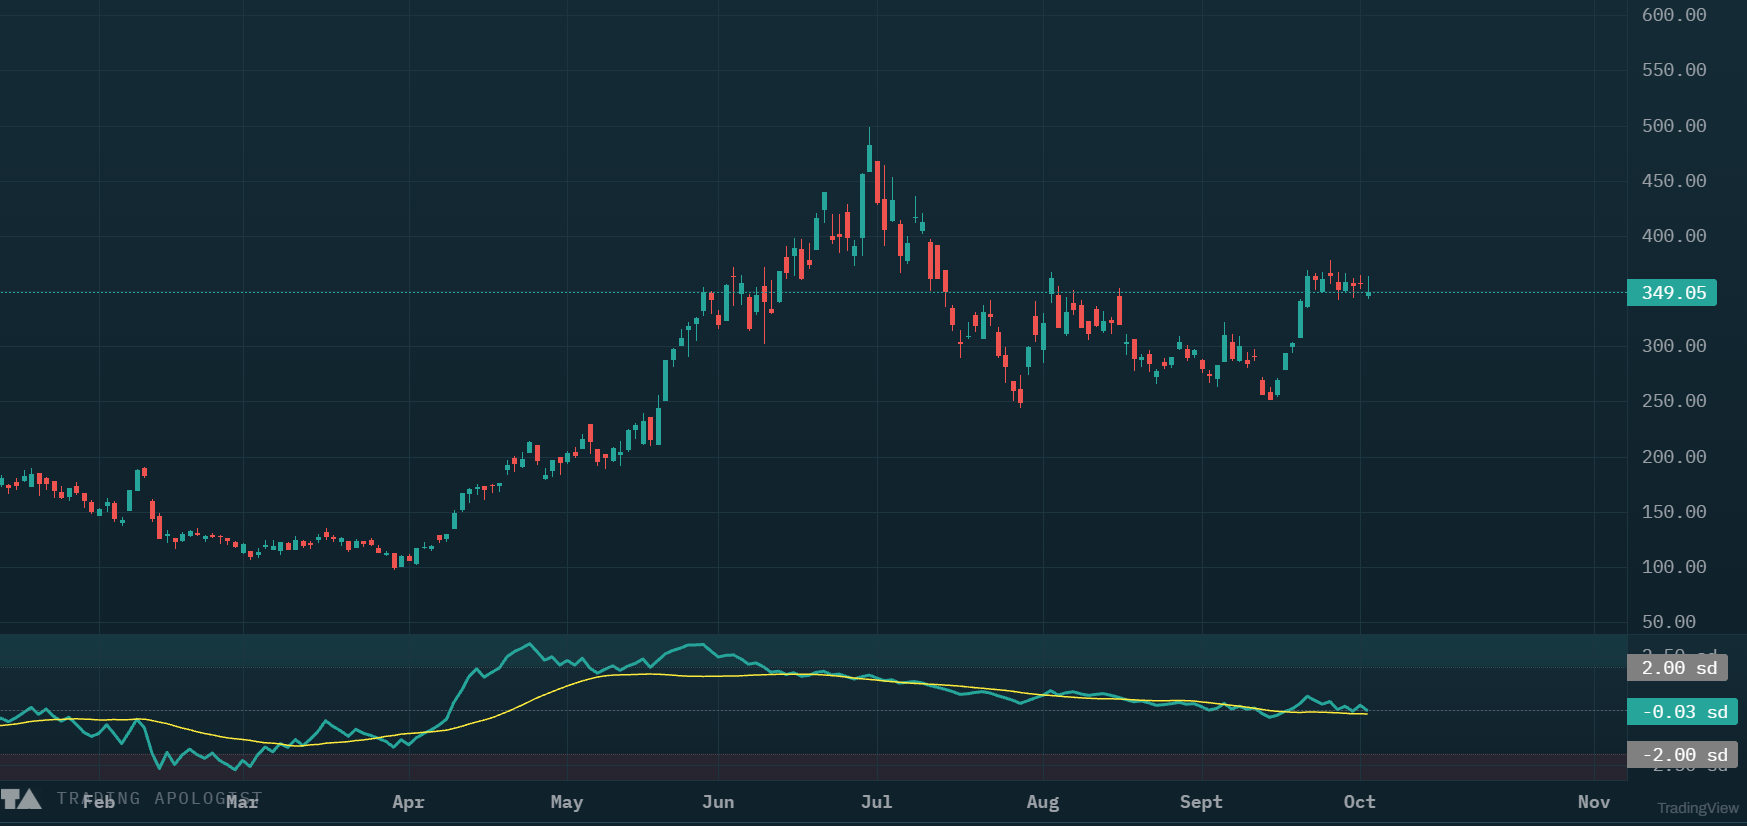
OBV z-score
On-balance volume built from whole-market tape volume, measured against its own mean in standard deviations so accumulation and distribution read the same on...
Read the guide
Money Flow
Each bar's volume split into retail-identified and institutional-consistent flow, with the buy and sell side MEASURED off the consolidated tape rather than...
Read the guide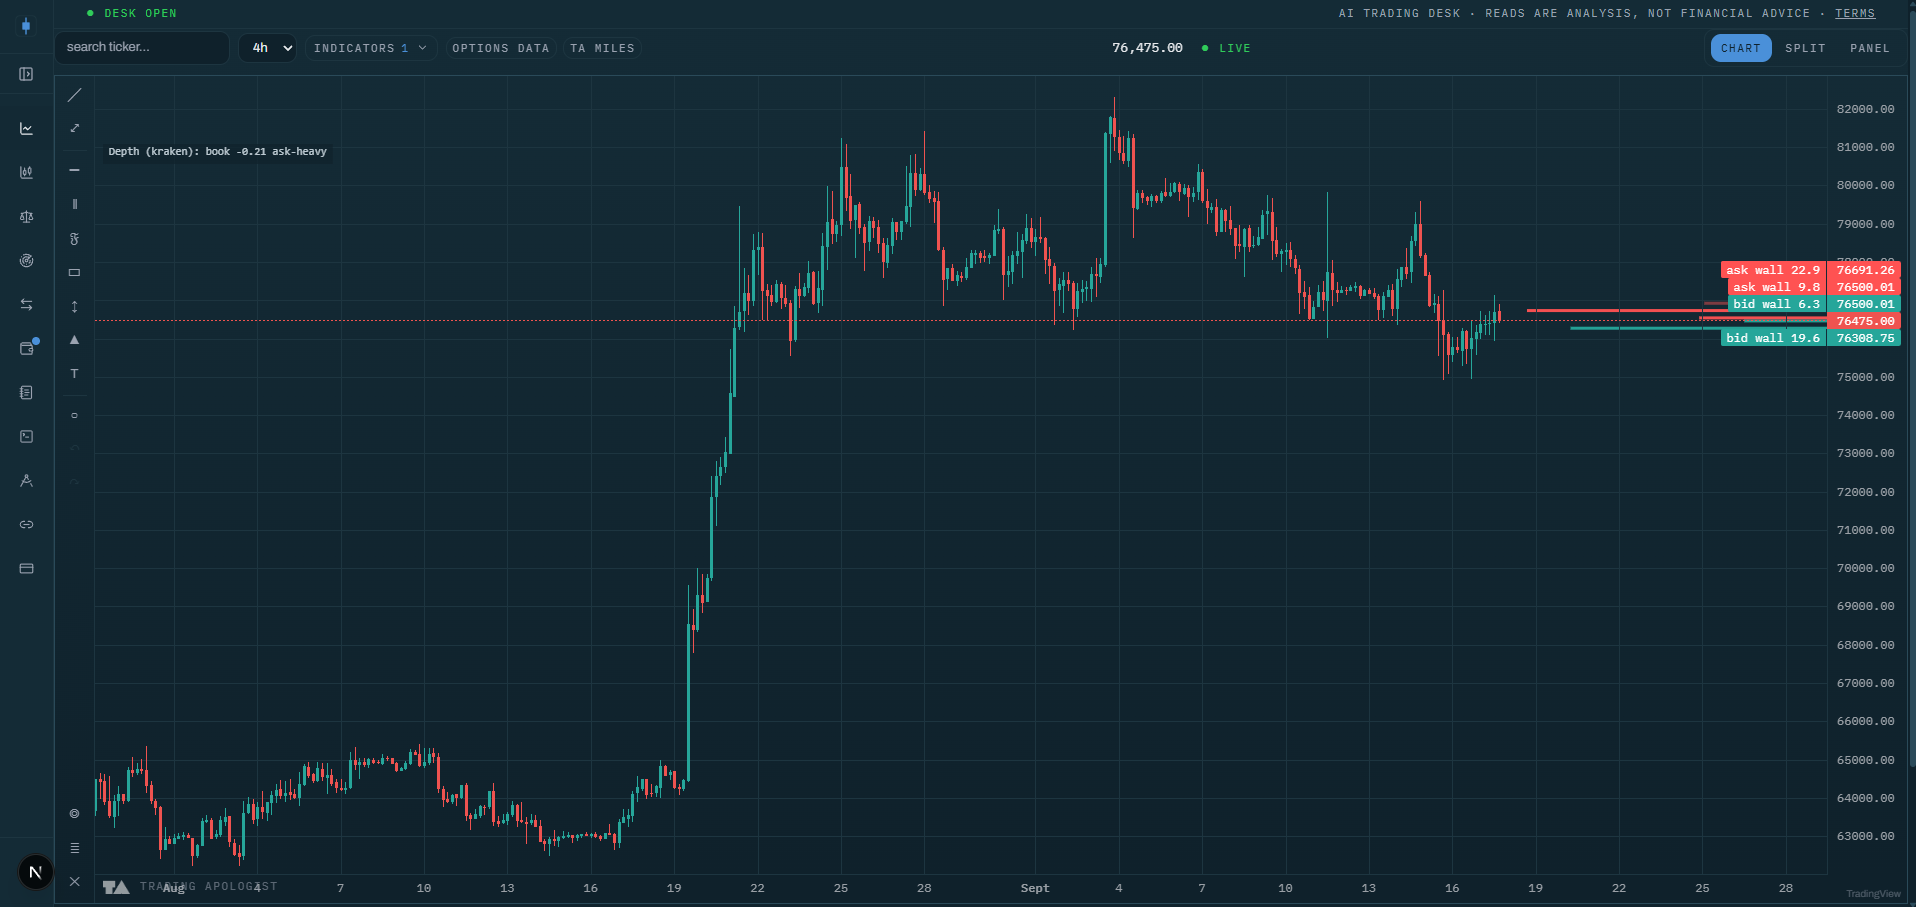
Order-Book Depth
The live exchange order book on CEX crypto charts: resting bid and ask walls plus a bid/ask imbalance readout.
Read the guide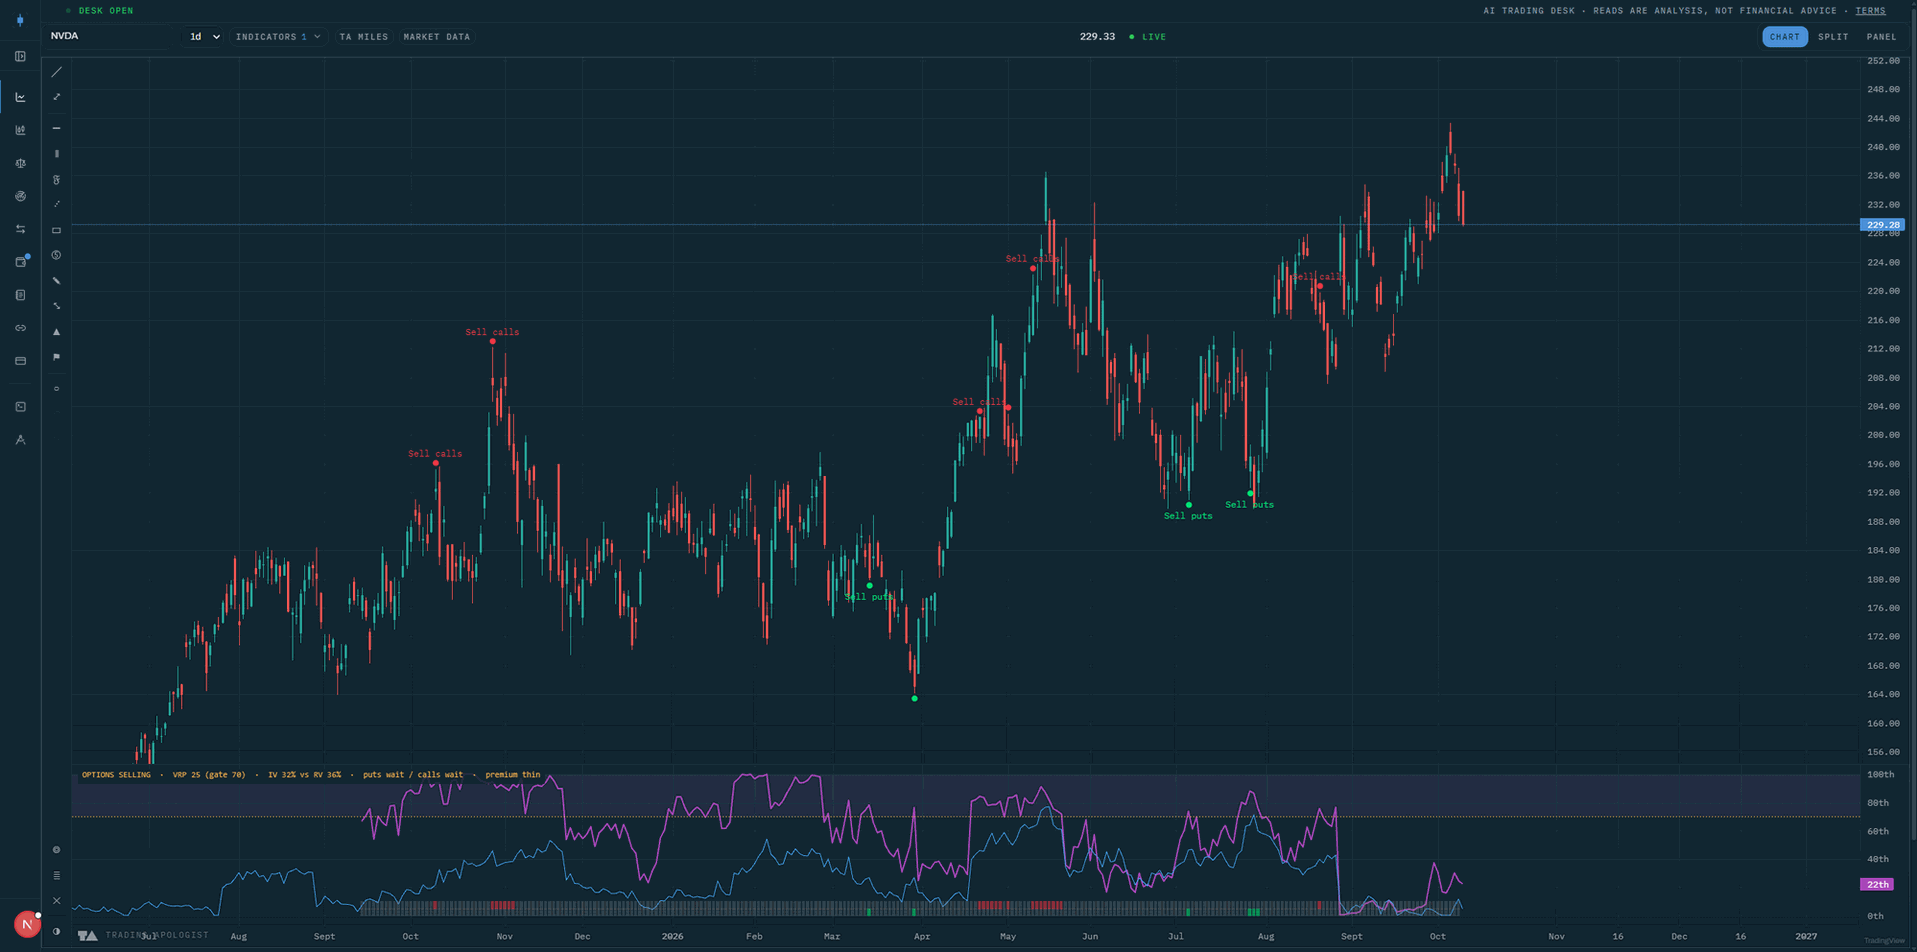
Volatility Adjusted Yield Options (VAYO)
Where option premium is expensive relative to the movement a stock has actually been delivering, with the side to sell marked on the chart once price is...
Read the guideThe TradingView scripts are invite-only.Request indicator access, or open the desk indicators on a live chart in theAI Trading Desk.