
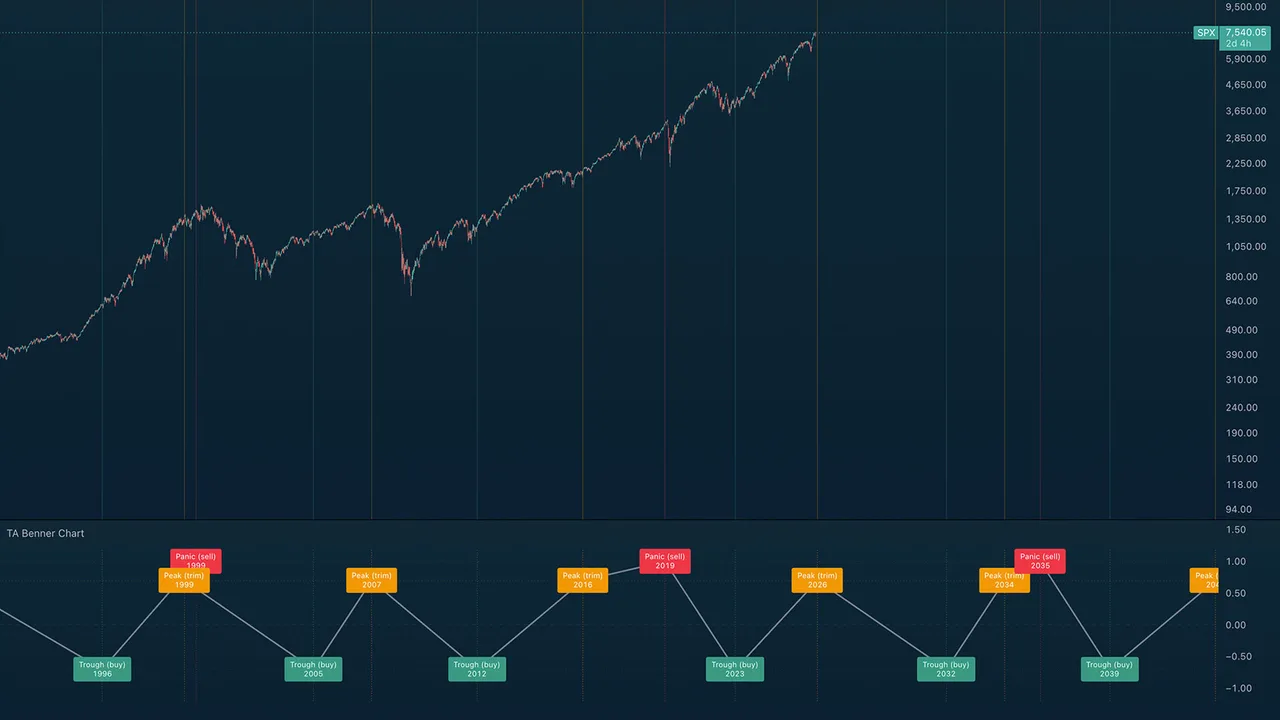
Samuel Benner's 1875 commodity-cycle forecast projected onto your chart: panic, peak, and trough years, extended through 2100. Benner published his cycle tables in Benner's Prophecies in 1875; an unreasonable number of major market turns since have landed on or near his years. This indicator plots the full calendar so you can judge it yourself. 2026 is a projected peak year.
What you see on the chart
- A lower pane with A/B/C event boxes, a connecting zigzag wave through past and projected turns, and vertical tier lines.
- Subtle vertical reference lines on the price chart marking each cycle year.
Works on Weekly and Monthly charts (intraday is skipped by design).
The three cycles
- A: Panic Years (red), repeating in 18/20/16-year gaps (…1907, 1927 … 2019, 2035): years of speculative panic. Benner's action: sell.
- B: Good-Times Peaks (orange), repeating 9/10/8 (…1999, 2007, 2016, 2026): high prices: the years to trim.
- C: Hard-Times Troughs (green), repeating 7/11/9 (…2012, 2023, 2032): low prices: the years to accumulate.
How to read it
This is a long-cycle context tool, not a timing signal, but a reminder of where you might be in the larger cycle while you work the shorter-term indicators. Position traders use it to lean allocations; everyone else can enjoy how often an 1875 table keeps landing.
Alerts
3 alerts, one per cycle, firing when a new cycle year begins.
TA Benner Chart is a Trading Apologist TradingView indicator.Request access to the scripts, or browseevery guide.
Educational and analysis purposes only. Not financial advice. See theterms.