
Purpose
Dark Pool Levels clusters the stock's off-exchange block prints into horizontal price levels, weighted by how much money actually changed hands there. Roughly 40 percent of US equity volume executes away from lit exchanges, and the biggest institutional orders concentrate there. This indicator shows you the prices where that size transacted.
It is the observed sibling of modeled level indicators: nothing here is a prediction or a model of pressure. Every level is built from prints that really happened.
Best used for:
- Finding institutional reference prices: a fat level is a price where large players established or exited real positions.
- Anticipating reactions: price returning to a heavy level tends to react there, as the players with basis at that price defend it.
- Distinguishing campaigns from one-offs: repeated prints at one price across days read as accumulation or distribution; a single giant print is a block reposition, a reference rather than a campaign.
- Building confluence: a dark pool level stacked with an option wall or volume node is a high-conviction zone; a lone level in a vacuum is a watch level.
What you see on the chart
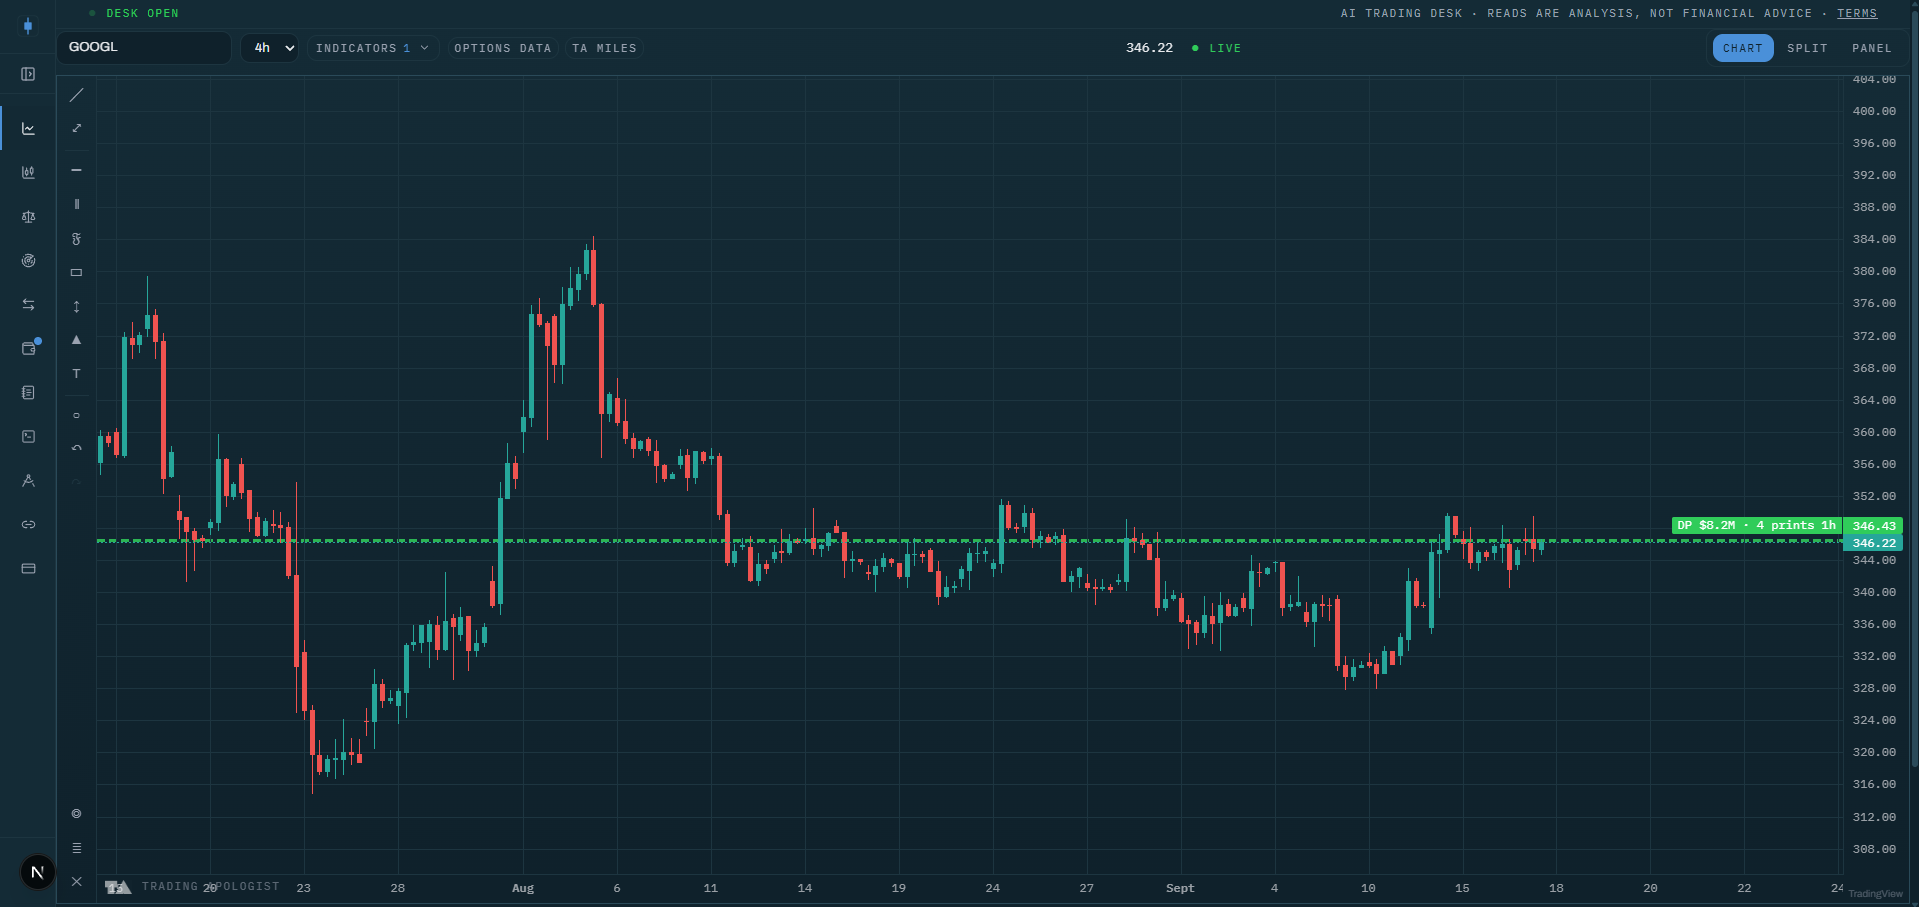
- Levels as horizontal lines or shaded bands (your choice) at the clustered prices, up to the eight heaviest by notional. Labels read like
DP $4.2M 3d: total notional and the age of the level. - Print bubbles placed at the actual time and price of the biggest individual prints, sized by print size relative to the largest print on screen.
- Freshness drives opacity: levels fade as their prints age. That fade is deliberate signal, not decoration; a level going pale is a level losing relevance.
- Color always means buys versus sells: net buy pressure in green, net sell pressure in red, and levels the quotes could not classify in neutral blue. There is no other colour mode, so a green level on this overlay always means the tape bought there.
How to read it
- A fat level is real inventory. Institutions transacted size there. Above the level, it tends to act as support (buyers defending their basis); below it, as resistance (trapped inventory looking to get out flat).
- Fresh beats heavy. A moderately sized level printed this week near spot is more actionable than a giant level from three weeks ago. Trust the fade: what has gone pale has mostly stopped mattering.
- Color adds direction. A level built mostly on prints at the offer (buy-classified) that price later revisits from above is a stronger support candidate than a mixed or sell-classified one. A neutral blue level is size without a readable direction, not a weak level.
- Campaign levels are the prize. The same price collecting prints day after day means someone is working an order there. Those levels get defended, and a clean break of one is meaningful.
- Confluence rule of thumb: dark pool level plus an option wall or a volume-profile node within a band is a zone to plan trades around. A dark pool level alone is a level to watch, not to trade blind.
How the engine works
The desk pulls the stock's recent dark pool prints from Unusual Whales, each with price, size, premium, timestamp, and the prevailing bid and ask. The engine drops prints below your notional floor and older than your lookback, then bins the rest by price (bin width is your cluster setting, as a percent of spot) and merges adjacent occupied bins so a level straddling a bin edge is not split in two.
Each cluster becomes a level with a notional-weighted price, total notional, print count, and a freshness score that decays exponentially with age. Buy/sell classification signs each print against the midpoint of the quote at execution time: above mid counts as a buy, below as a sell, exactly at mid carries no information. The top eight levels and the thirty largest dated prints reach the chart.
Honest limitations: prints are reported with a delay, so this is a 15-minute-delayed view. Dark pool data shows that size traded at a price, not who traded or why; a print is not automatically bullish or bearish, which is exactly why the buy/sell classification stays conservative and leaves ambiguous prints neutral.
Key settings
Display settings (instant repaint):
- Levels:
lines,bands, ornone(bubbles only). - Labels:
minimal(top four levels),full(every level with print counts), oroff. - Opacity 10 to 100 percent and bubble size 50 to 200 percent.
- Print bubbles: on or off.
Clustering settings (these recompute the chart):
- Lookback: 1, 5, or 20 trading days (default 5).
- Min print notional: $250k, $1M, or $5M (default $1M).
- Cluster width: 0.05 to 1 percent of spot (default 0.25).
Availability
US equities only; not available on pairs or crypto charts. Prints are observed with a 15-minute delay. Included from the Plus plan up.
Dark Pool Levels is an AI Trading Desk indicator. See it on a live chart in the AI Trading Desk, or browseevery guide.
Educational and analysis purposes only. Not financial advice. See theterms.