
Purpose
Dealer Gamma tells you whether options dealers are currently positioned to dampen price moves or to amplify them, and more importantly whether that has just changed.
When dealers are net long gamma, their hedging works against the move: they sell into strength and buy into weakness, which pins price near the heavy strikes and favours fading extremes. When they are net short gamma, hedging works with the move instead, so pushes extend and gaps become more likely.
Where GEX Profile shows that positioning strike by strike for today, Dealer Gamma shows the whole-surface figure as a history, so you can see the regime and the moment it turned.
Best used for:
- Choosing tactics for the session: fade extremes in positive gamma, trail breaks in negative.
- Catching regime changes, which is what the day-over-day change exists for.
- Judging whether a range is likely to hold or likely to break.
- Setting stop distance: negative gamma deserves more room, positive gamma less.
What you see on the chart
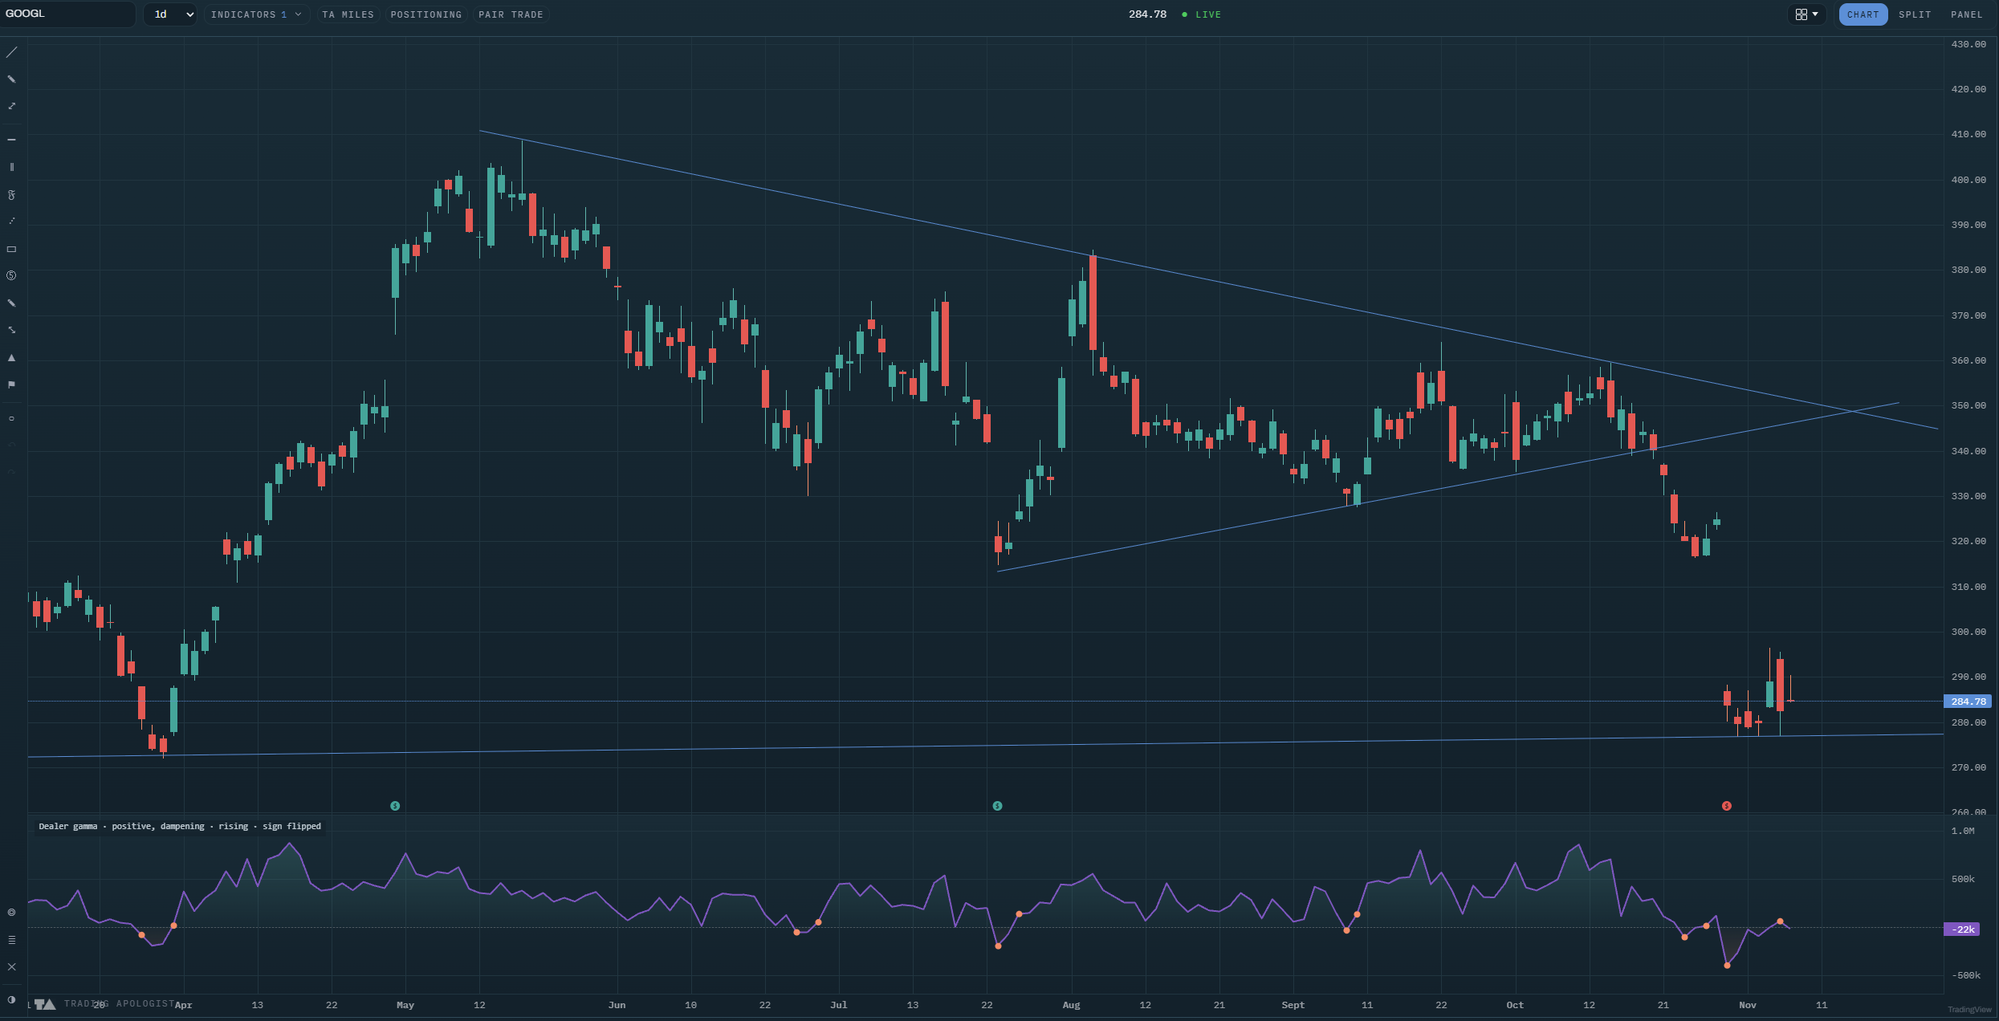
A pane below price with the zero line always drawn, because the sign is the whole reading.
- The net gamma line: the daily whole-surface figure, above or below zero.
- Two fills: the area either side of zero, in separate colours, so the regime reads without looking at numbers.
- Sign-change marks: a dot on each day the regime actually flipped direction.
- A legend naming the current state and whether it is rising or falling.
The legend states the regime in words, for example "Dealer gamma · positive, dampening · rising · sign flipped", so you get the reading without interpreting the shape.
Optionally, and off by default, the regime carries onto the price chart itself as a candle tint: each candle's outline takes the colour of the regime that bar was in, so you can see where the regime turned and how price behaved on each side of it. Candle bodies keep their up and down colours so direction stays readable, and bars with no stored reading are left alone rather than greyed, because a third colour would imply a third regime that does not exist.
How to read it
- Positive and rising: expect dampening. Dealers hedge against moves, so ranges hold better, extremes tend to fade, and mean-reversion tactics have a structural tailwind.
- Negative: expect amplification. Hedging chases the move. Do not fade the first push through a level, and give trailing stops more room.
- The day-over-day change is the leading part. Gamma flipping sign is a regime change, not a level, and it usually matters more than whether the figure is large. The sign-change marks are there so you can see where that happened rather than reading it off the slope.
- Use the tint to check your read against history. It starts switched off, so the pane above is what you see first. Ticking "Tint each candle by that bar's own regime" shows how price actually behaved in each past regime on this symbol, which is a faster sanity check than remembering. With it on, the outlines and wicks through a dampening stretch all carry the dampening colour, whether or not each bar closed up.
- Size matters less than sign. The absolute figure varies enormously between symbols, so switch to the percentile display if you want to compare a reading against this name's own range rather than against another ticker.
How the engine works
The pane reads a stored daily history of whole-surface gamma exposure for the symbol, summing the call and put sides into one net figure per day. The day-over-day change is taken across stored days only, so a weekend or a gap in coverage carries no change rather than a repeated one: a repeated change would read as a second regime shift that never happened.
Sign changes are reported only where both days either side are measured, never across a gap, and never on the still-forming bar.
Honest limitation: this is the whole-surface daily aggregate, not a per-strike profile, and it is inferred dealer positioning rather than reported positions. The standard convention is that dealers are net short the options customers bought, which is widely used and not directly verifiable. Treat it as a strong structural read on liquid names and a weaker one elsewhere.
Key settings
- Lane: the raw net gamma level, or a trailing percentile that makes the reading comparable across symbols.
- Net gamma: the line itself, with colour, width and style.
- Dampening fill and amplifying fill: the two regime areas, each with its own colour and transparency.
- Sign-change marks: on or off, with a size control.
- Tint each candle by that bar's own regime: carries the regime onto the price chart.
Availability
US equities with a listed options chain, daily and weekly charts, on the most actively tracked names. A symbol outside that set gets no pane rather than an empty one. Not available on pairs or crypto charts. Included from the Pro plan up.
Dealer Gamma is an AI Trading Desk indicator. See it on a live chart in the AI Trading Desk, or browseevery guide.
Educational and analysis purposes only. Not financial advice. See theterms.