
Purpose
Earnings Move Cone answers one question: is the options market charging enough for this name's habit of surprising on earnings day?
It draws what options are currently pricing for the next print as a cone around price, and marks every recent earnings date so you can see what the stock actually did. Pricing and history, on the same axis, in the same units.
Best used for:
- Deciding whether to sell premium into a print or buy it.
- Sizing an earnings position against what the stock really does, not what it feels like it does.
- Spotting names the market consistently under-prices or over-prices on event risk.
- Setting post-print targets that sit inside the range the market is actually paying for.
What you see on the chart
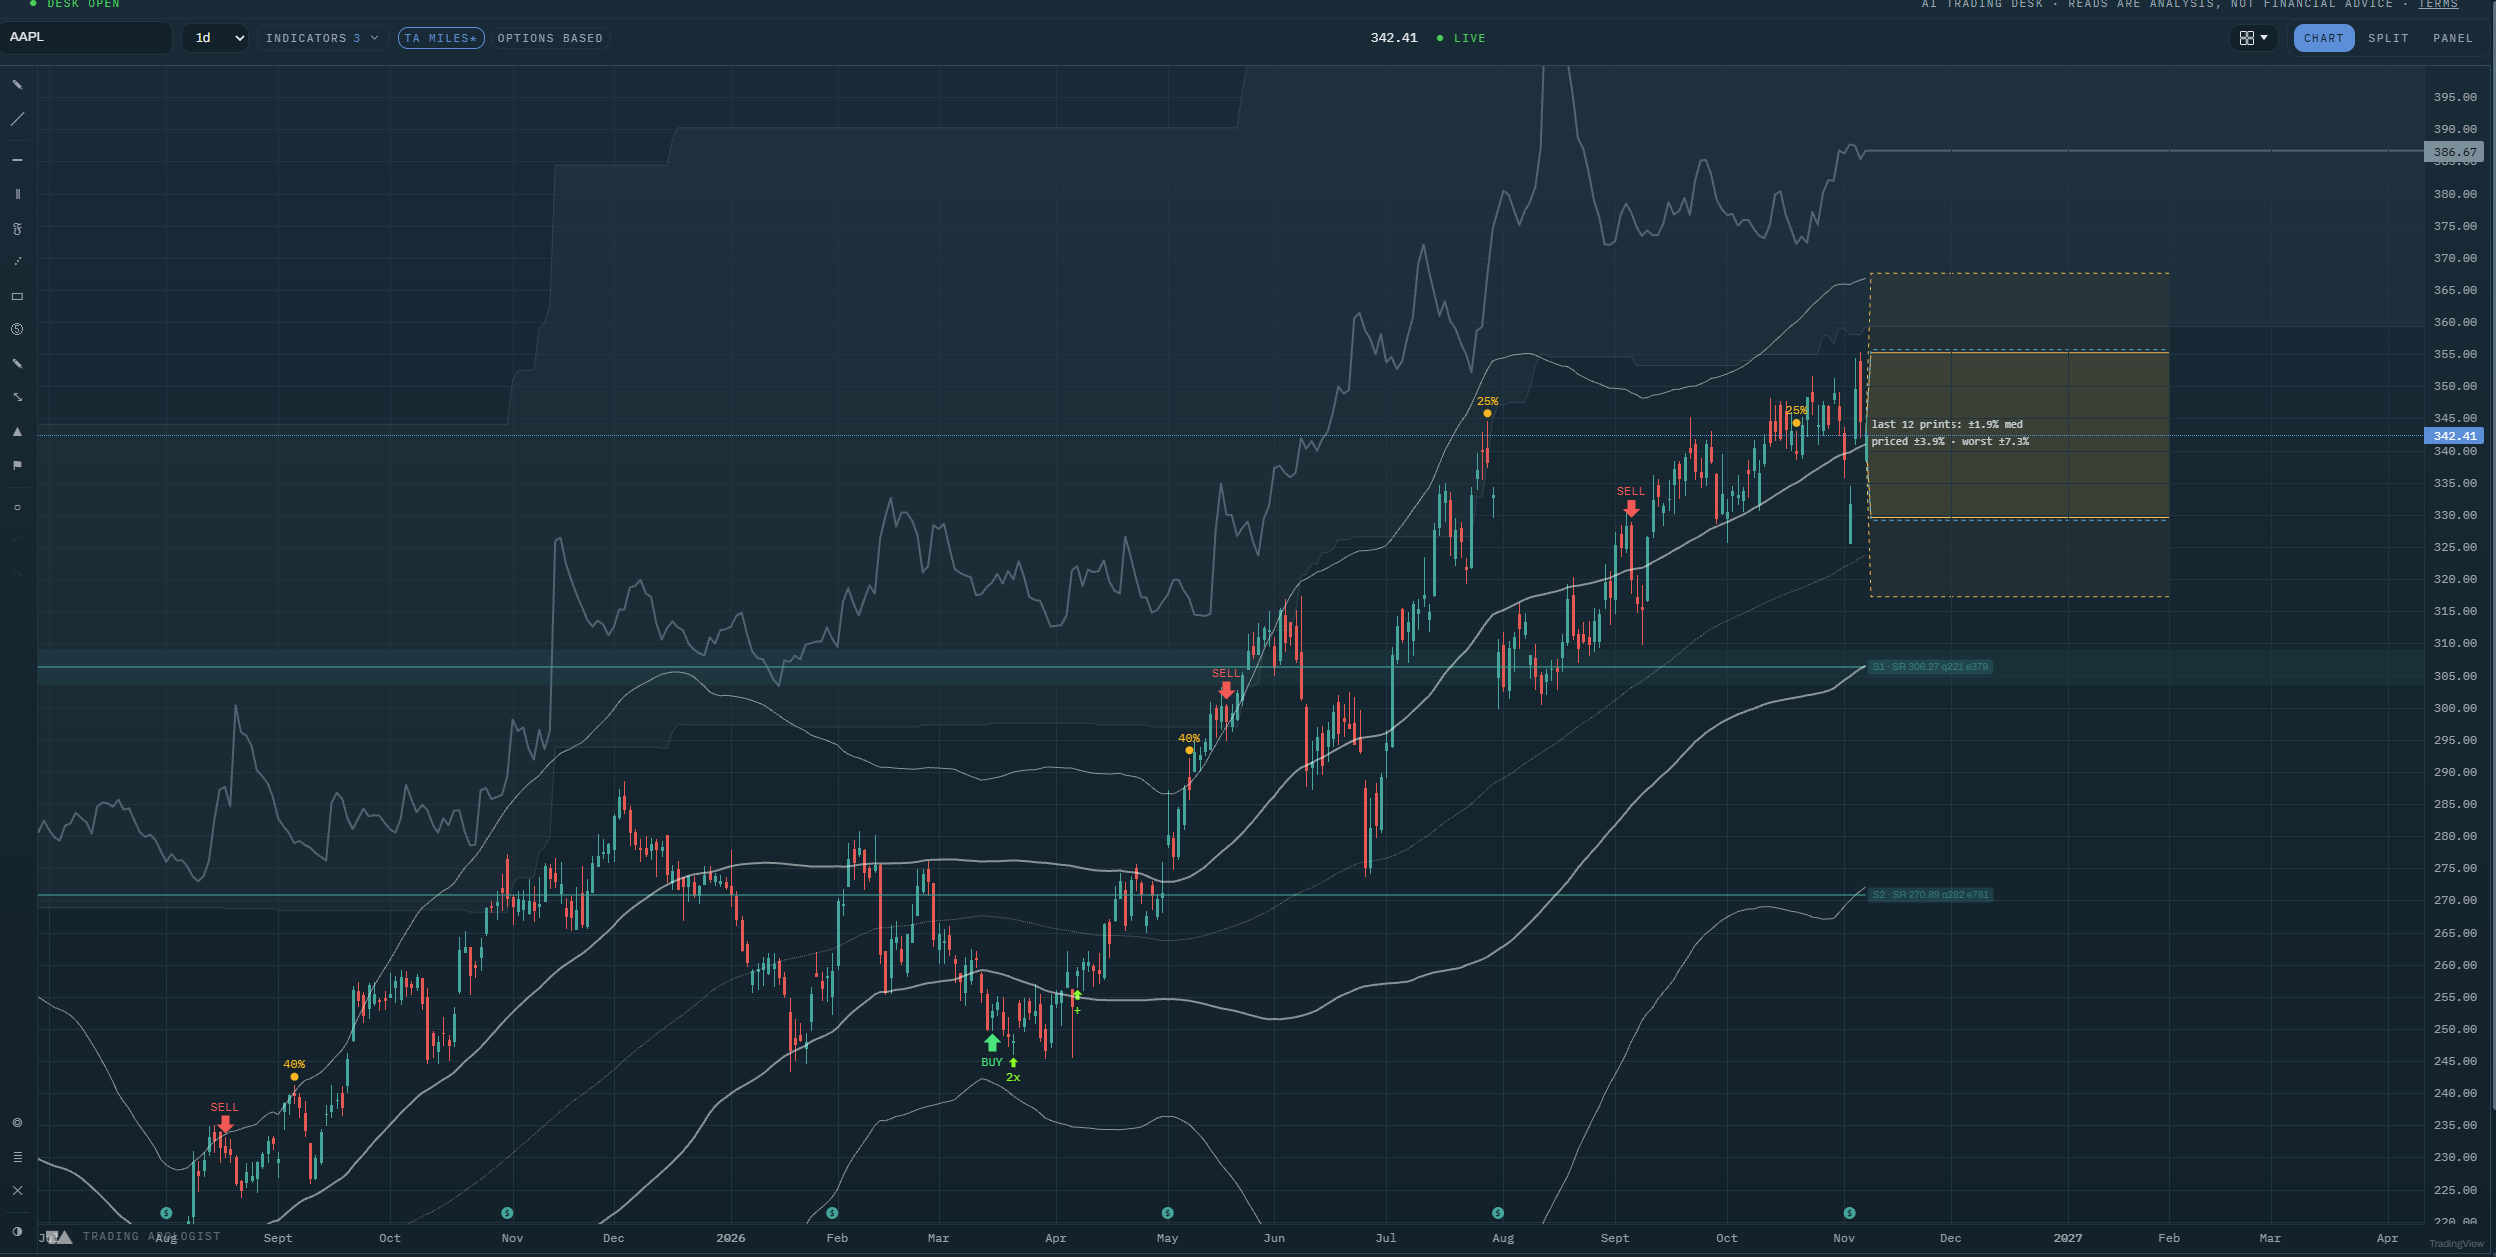
- The cone: a shaded band projected forward from the current price, covering the move options are pricing for the next earnings date.
- A reading in the corner: the median of the last several prints beside what is priced now and the worst move in the window, so you get the typical case and the tail in one line.
- Past-print marks: a dot on each earnings date, labelled with the move that followed it.
How to read it
- Compare the cone to the dots, not to your expectations. A cone much wider than the recent prints means you are being paid generously for event risk. A cone much narrower means the market has stopped respecting this name's history.
- Read the median and the worst number together. A stock with a 2% median and a 7% worst case is not a 2% stock. Position for the median, survive the tail.
- The dot colours are the reading. One tone means the move landed inside what was priced; the other means it broke out. A name with several breakouts in a row is one the market keeps underestimating.
- The cone is a range, not a forecast. It says nothing about direction. A stock finishing at either edge is a perfectly ordinary outcome.
- Watch the cone widen into the print. Implied volatility normally rises as the date approaches, so the cone expands. That widening is the premium you would be selling.
How the engine works
The cone comes from the options market's own implied move for the expiry nearest the next earnings date, projected forward from the current price. The past prints come from the stock's own history: each earnings date, and the actual move that followed it.
Nothing here is smoothed or modelled. The cone is what is priced and the dots are what happened.
Honest limitation: the implied move is an estimate derived from option prices around one expiry, and it can shift materially in the days before a print as positioning changes. The past-print window is finite, so a name that has changed character (a new CEO, a new product cycle) carries history that may no longer describe it.
Key settings
- Reaction range: show or hide the cone itself, with its own colour and transparency.
- Priced move: show or hide the bracket for what is currently priced.
- Past print marks: show or hide the dots, with a size control.
The past-print marks cannot be recoloured, and that is deliberate. Their colour carries the inside-or-outside reading, so a colour control there would quietly break what they tell you.
Availability
US equities with a listed options chain. Not available on pairs or crypto charts. Included from the Pro plan up.
Earnings Move Cone is an AI Trading Desk indicator. See it on a live chart in the AI Trading Desk, or browseevery guide.
Educational and analysis purposes only. Not financial advice. See theterms.