
Purpose
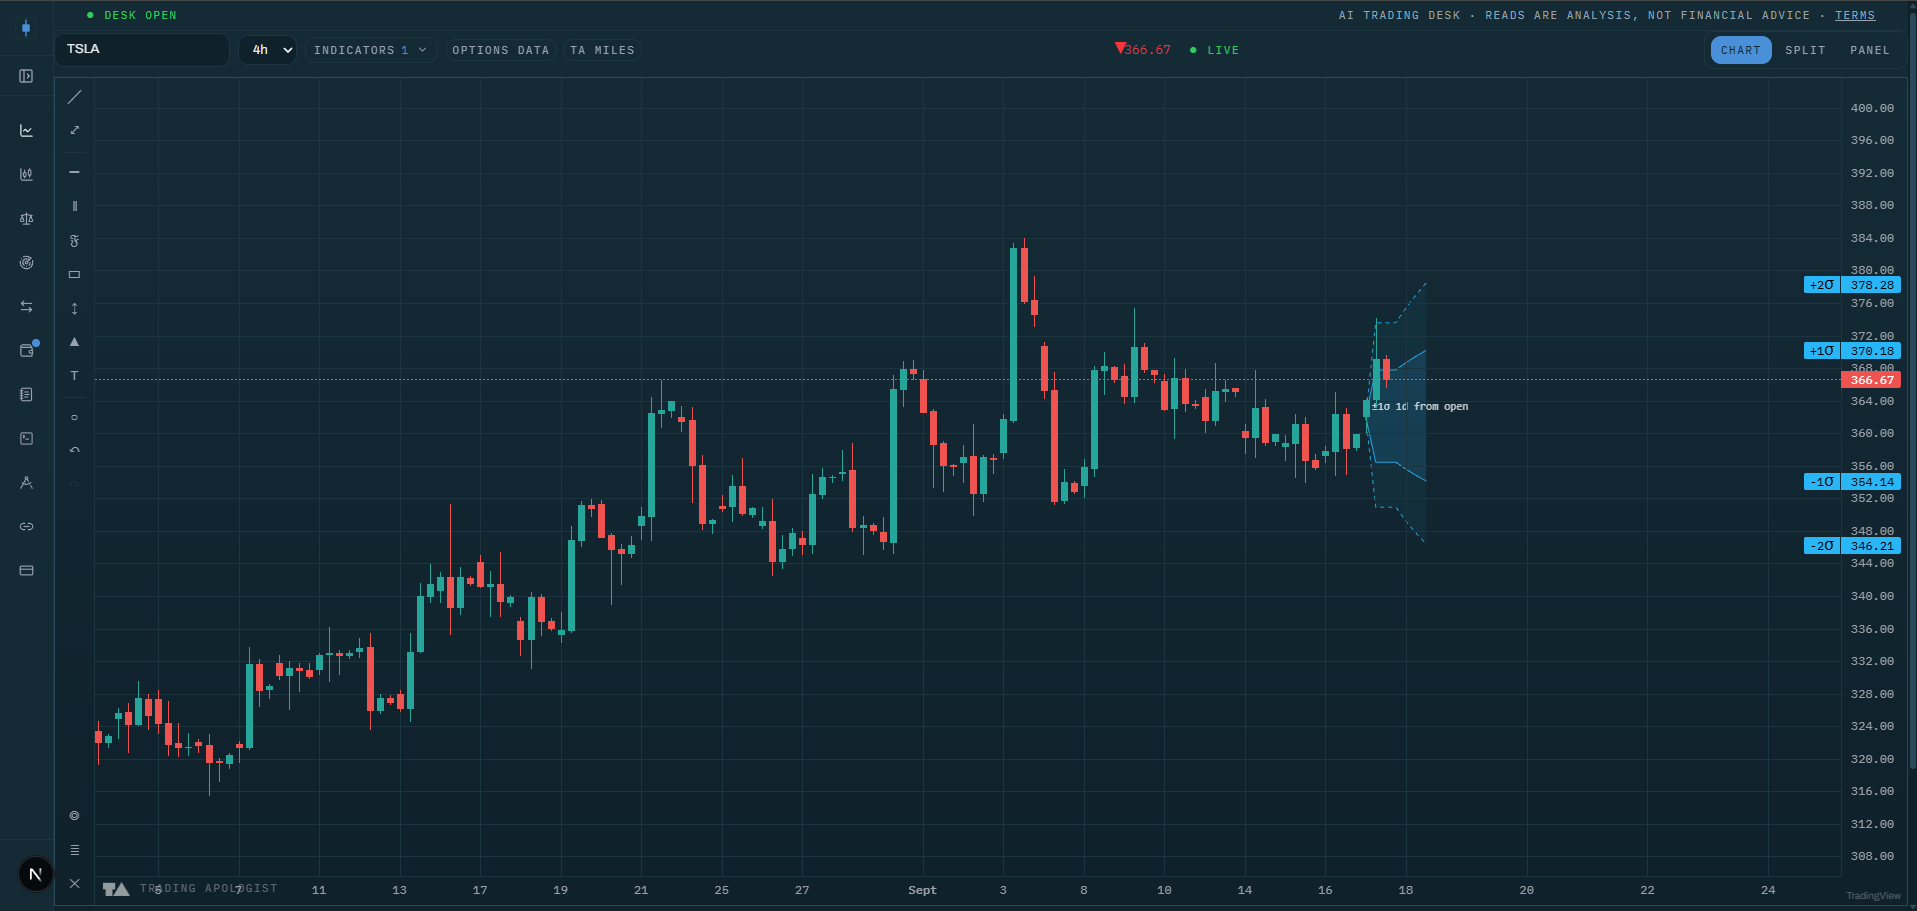
The Expected Move Cone projects the options-implied price range forward in time: a shaded cone showing where the options market expects price to stay, with roughly 68 percent confidence inside the 1-sigma cone and roughly 95 percent inside the optional 2-sigma cone.
It answers a question every trade plan should ask: is my target a normal move, or does it need something the market has not priced?
Best used for:
- Reality-checking targets and stops: a target outside the 1-sigma cone needs an outsized, statistically unpriced move to get there.
- Reading the volatility regime: price living inside the cone favors premium selling and mean reversion; repeated closes outside it favor momentum and long premium.
- Sizing the earnings bet: anchored to earnings, the cone shows exactly how much move the market has priced into the event.
- Judging other levels: an option wall inside the cone is a realistic pin candidate; a wall far outside it is decoration.
What you see on the chart
A shaded blue cone that starts at an anchor point and widens as it projects past the last bar into future time on the right of the chart:
- The 1-sigma cone is the main band. Optional edge labels print the upper and lower prices at the cone mouth and on the price axis.
- The optional 2-sigma cone draws a second, wider band outside the first.
- The cone's mouth sits at the anchor: the live bar, the session open, the week open, or the next earnings date, depending on your setting.
With a fixed anchor (session open or week open) the cone stays put while price moves, so you can literally watch price walk out of its expected range. With the auto or now anchors the cone re-roots at the current price.
How to read it
- The cone is the range option sellers are being paid to defend. Inside it, nothing statistically unusual is happening, whatever the candles feel like. The first close outside it is information.
- One poke outside is a stretch; repeated closes outside are a regime. A single tag of the cone edge often mean-reverts. A market that keeps closing beyond the edge is telling you realized volatility is beating implied, and momentum tactics beat fading.
- Watch the width, not just the edges. A cone that widens day over day means event risk is being priced in (earnings, macro prints). A cone that collapses right after an event is the vol crush; targets computed off yesterday's width are stale.
- Use it as a filter for everything else. GEX walls, dark pool levels, and OI builds inside the cone are live; the same levels outside the cone are unlikely to be tested within the horizon.
- Earnings anchor: the cone rooted at the earnings date is the market's priced-in earnings move. If your thesis needs more than that, you are trading against the priced distribution and should size accordingly.
How the engine works
The cone is computed from the stock's at-the-money implied volatility: upper and lower edges are the anchor price times exp(±iv × sqrt(days/365)), the standard lognormal expected-move formula. The 2-sigma cone doubles the exponent. Implied volatility and spot come from the desk's Unusual Whales options data; the earnings anchor pulls the next confirmed earnings date.
The math runs in your browser on already-fetched data, so every setting change repaints instantly without recomputing the chart.
Honest limitation: the cone assumes the current implied volatility describes the whole horizon. It is a probability statement, not a boundary; roughly one day in three, price should close outside a 1-sigma cone. Treat the edges as odds, never as walls.
Key settings
- Anchor:
auto(session open intraday, live bar on daily and up),now,session open,week open, orearnings. Fixed anchors are the ones that let you see price leave the cone. - Horizon: 5 to 90 days of projection. Disabled for the session and week anchors, which carry their own natural horizon.
- 2-sigma cone: draw the outer band as well.
- Fill opacity: 4 to 40 percent.
- Labels:
off,minimal(1-sigma prices), orfull(1-sigma and 2-sigma prices).
Availability
US equities only; not available on pairs or crypto charts. Included from the Plus plan up.
Expected Move Cone is an AI Trading Desk indicator. See it on a live chart in the AI Trading Desk, or browseevery guide.
Educational and analysis purposes only. Not financial advice. See theterms.