
Purpose
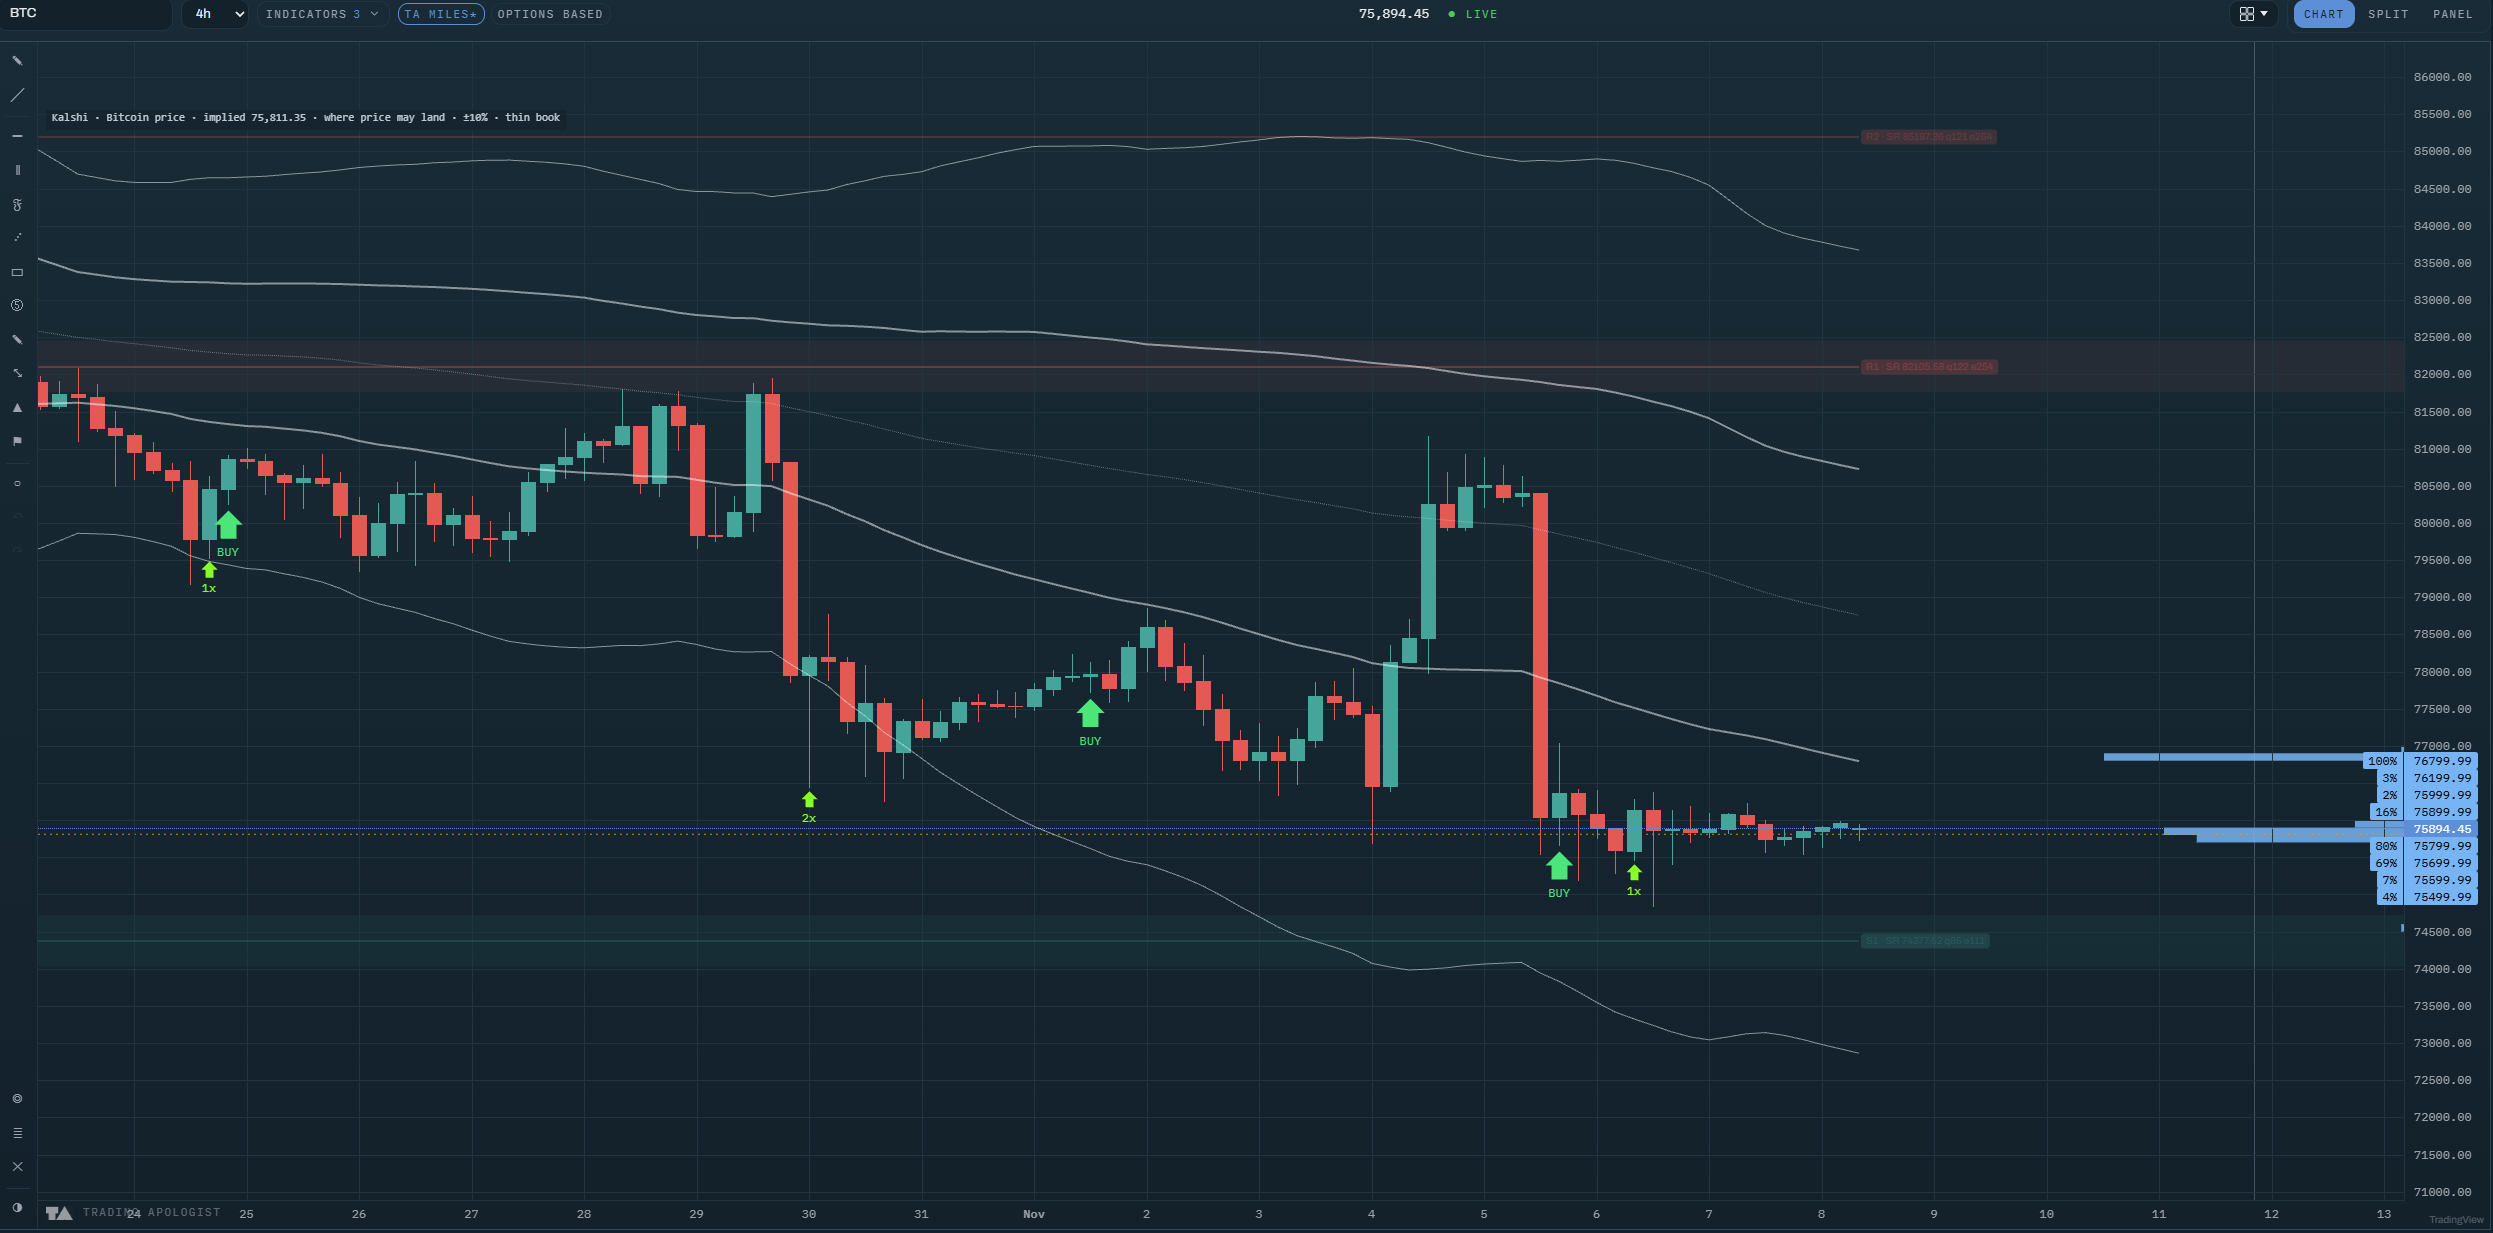
Kalshi Prediction Markets puts a real prediction market against your own price axis.
Every level on the ladder is one traders are actively pricing with money, so the reading is not a model's opinion about where price might go. It is what a market of participants is currently willing to pay for each outcome, drawn at the price it refers to.
Best used for:
- Seeing where a live market actually expects price to settle, beside your own chart.
- Sanity-checking a target: if the market gives your level a 4% chance, that is worth knowing before you size for it.
- Reading event risk on index and crypto underlyings in probability terms rather than in volatility terms.
- Comparing the market's implied price with spot.
What you see on the chart
A gutter at the right edge of the price pane, with bars drawn at the price levels they describe.
- The bars: one per level, length showing how much probability sits there.
- The implied price: a dashed line at the level the market prices at a coin flip, which is its own best guess at where price settles.
- Level labels on the price axis for the heaviest few, so you can read the probability against the price it belongs to.
- A legend naming the underlying, the implied price, the view and the focus window, for example "Kalshi · Bitcoin price · implied 75,811 · where price may land · ±10%".
How to read it
There are two views and they answer different questions. Choosing the wrong one is the single most common way to misread this indicator, which is why the legend always names the one you are on.
- Where price is likely to land (the default) draws how much of the market's probability sits between each pair of levels. The bars peak where traders think price will actually settle, and that peak is the reading. On a typical ladder, two or three levels carry most of the probability.
- Chance of ending above each level draws the raw market odds instead. These only ever fall as the level rises, by definition: the chance of finishing above a low level is near certain and above a high one near zero. That makes it the right shape for reading one specific level, and the wrong shape for reading a distribution, because on a ladder with hundreds of levels it fills in as a solid wedge.
Beyond that:
- The implied price is the market's midpoint, not a target. It moves with the market and is usually close to spot.
- Use focus to cut the noise. A daily crypto ladder can carry hundreds of levels spanning far beyond your chart, and the distant ones are near-certainties: a 99.5% chance of being above a level well below spot is true and useless. Focus hides them.
- A "thin book" label is information. It means the quotes on that ladder are out of order, which happens when participation is low. The ladder is left as it is rather than tidied, because sorting it into shape would invent confidence the quotes do not carry.
How the engine works
The ladder is read from Kalshi's own price-threshold markets for the charted underlying: each market is a contract on price finishing above or below a given level, and its price is the market's probability.
The distribution view takes the difference between adjacent levels, which is the probability mass between them. It is scaled to the largest bucket so the shape is readable regardless of how finely the levels happen to be spaced.
Where the levels describe an index and your chart shows a fund that tracks it, the levels are converted into your chart's units for you and the legend names the underlying, so an index level is never mistaken for a quote on your own instrument.
A single tick of disagreement between adjacent levels is treated as quote noise rather than disorder, because these contracts price in cents and neighbouring levels cross by a cent routinely.
Honest limitation: coverage is a fact about what Kalshi lists, not a fault. It runs price-threshold markets on index and crypto underlyings, not on individual shares. Under a single share the ladder says there is nothing to configure. Under a coin or an index proxy that is not yet mapped, it says that instead. Those are different statements and the indicator keeps them apart rather than showing you a blank.
Key settings
- Draw:
ladder,odds, orboth. - Read:
where price is likely to landorchance of ending above each level. - Focus ± % of implied price: hides distant levels. Set 0 to see every level.
- Ladder width and opacity: how much of the pane the gutter uses.
- Label each rung on the price axis: on or off. Labels are capped at the heaviest few, so a ladder with hundreds of levels does not turn the price axis into a column of percentages.
The macro odds pane is still available as a second mode, for market-wide events that have no price structure at all and so can never be drawn as a ladder.
Availability
Index and crypto underlyings, which is what Kalshi lists price-threshold markets on. Not available on pairs. Included from the Pro plan up.
Kalshi Prediction Markets is an AI Trading Desk indicator. See it on a live chart in the AI Trading Desk, or browseevery guide.
Educational and analysis purposes only. Not financial advice. See theterms.