
Purpose
OBV z-score takes On-Balance Volume, the running total of volume added on up days and subtracted on down days, and measures it against its own recent average in standard deviations. The result tells you how unusual the current level of net participation is for this symbol, with a slower mean line to read the regime off.
It measures interest, not direction. Raw OBV is nearly unreadable on its own because its level depends entirely on which bar the chart began counting from, so it compares across neither symbols nor timeframes. Expressing it in standard deviations removes that arbitrary starting point, which is what makes the shape worth reading.
Every value is computed from volume that actually traded, on the whole market's tape rather than one venue's slice of it. That matters more here than on any other indicator in the suite, because OBV is nothing but volume: fed a single exchange's prints, which is a few percent of the real total, it produces a line that is mostly noise dressed up as a signal.
Best used for:
- Confirming or doubting a price move: a new high that the OBV line does not follow was made on thinner participation than the last one.
- Reading the macro trend in interest: the mean line's side of zero and its slope say whether accumulation has been building or draining over months, not days.
- Spotting accumulation while price does nothing: a rising line through a flat price range is the classic quiet-accumulation tell.
- Comparing symbols honestly: plus two standard deviations means the same thing on a mega-cap and a small-cap, which a raw volume total never could.
- Judging whether a stretch has room: the shaded zones show how far the current run sits from this symbol's own normal.
What you see on the chart
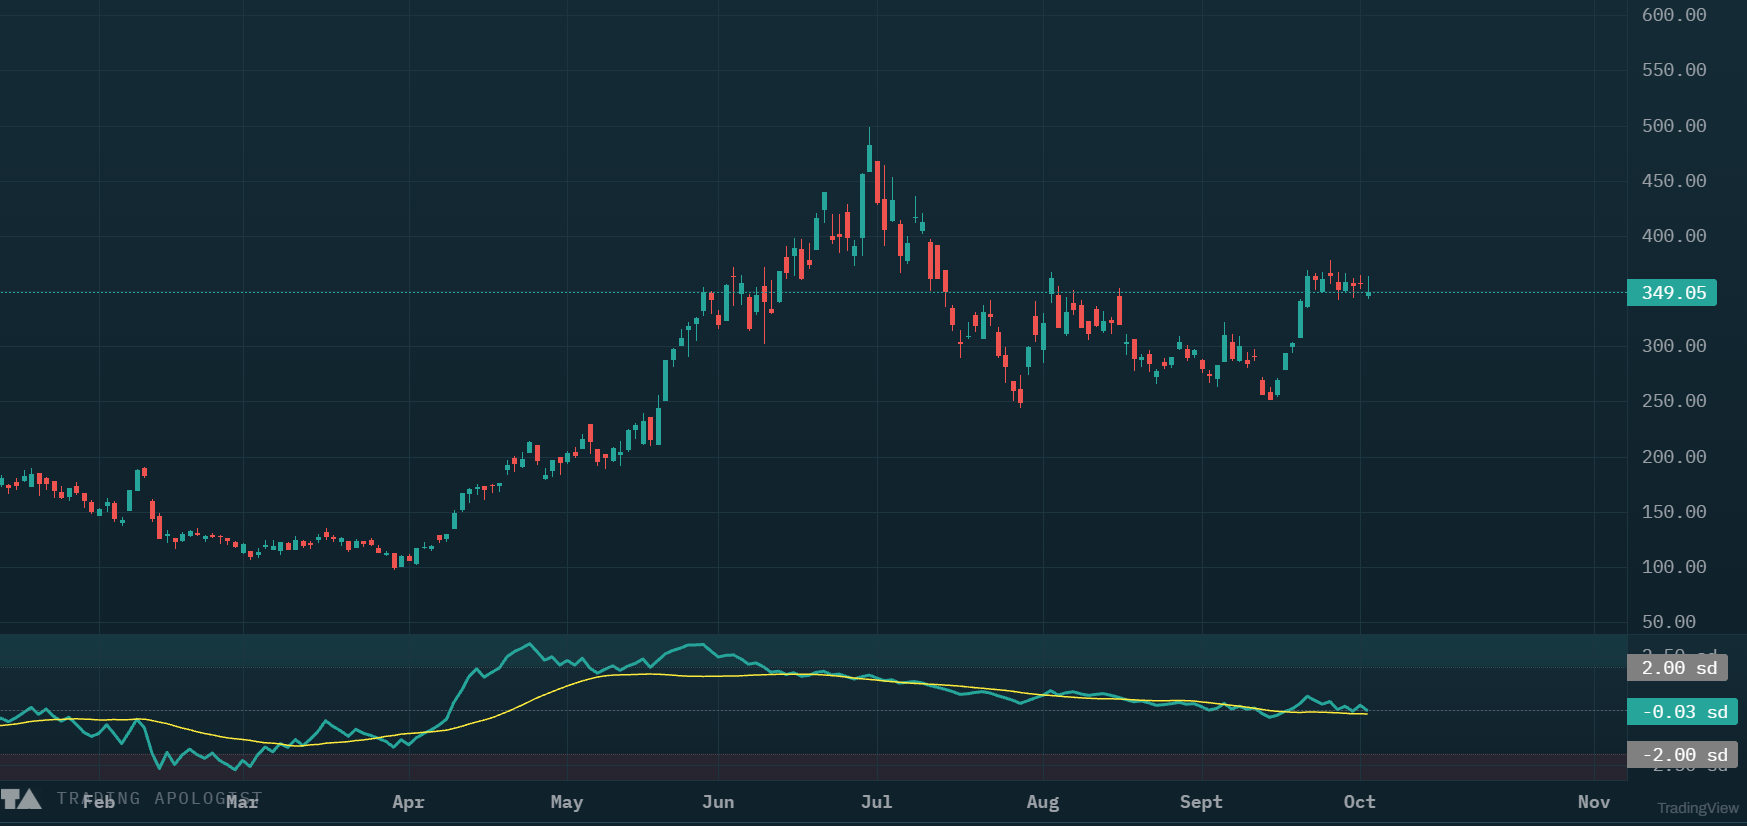
A separate pane below price, scaled in standard deviations rather than shares, so the axis reads sd:
- The OBV line in teal: On-Balance Volume as standard deviations from its own 100-bar average.
- The mean line in yellow: OBV's 20-bar average in the same units. It is the slow line, so it lags deliberately.
- A dashed zero line: OBV sitting exactly on its 100-bar average. Above is above-average participation, below is below-average.
- Dotted guides and shaded zones at plus and minus two standard deviations, tinted teal above for unusually heavy accumulation and red below for unusually heavy distribution.
- Blank bars at the left edge while the window fills. Nothing is drawn rather than a zero, because zero is a real reading here and would claim "exactly at its average" when the truth is "not yet measured".
How to read it
- Divergence against price is the main event. Price makes a higher high and the teal line does not: participation is not confirming the move. Price makes a lower low and the line holds up: someone is absorbing supply. Read in isolation this pane says little; price is what it needs comparing against.
- The yellow line is the regime. Its side of zero and its slope are the medium-term read on whether interest is building or leaking away. It is slow on purpose and is not there to be traded off.
- A cross is a state change, not an entry. It marks the moment net participation turned relative to its own recent average, and it fires often enough that trading it alone would be noise.
- The zones mean unusual, not reversible. Plus two standard deviations says this run is large for this symbol, which often precedes a pause. It is not an overbought reading, and a strong trend can live there for weeks.
- A flat yellow line is informative, not broken. On a steadily trending symbol OBV holds a near-constant distance from its longer average, so the mean line genuinely flattens. That is the pace of accumulation reading as steady.
How the engine works
The volume is the desk's own market data, not a third-party indicator feed. US equity bars come from Alpaca's consolidated SIP tape where the plan allows it and from Unusual Whales otherwise, and both are whole-market volume; the chain is built so that an indicator is never handed one exchange's partial view. Crypto volume is exchange volume from the venue the chart is drawn on. Daily and weekly equity bars count regular-hours volume only while intraday bars include extended hours, so the same symbol legitimately reads differently on a 1D chart and a 1h one.
Each bar then adds its whole volume to a running total if it closed up, subtracts it if it closed down, and carries the total flat on an unchanged close. The desk takes a 100-bar average and a 100-bar standard deviation of that total, then plots the gap between total and average in units of that deviation. The yellow line is the total's 20-bar average pushed through the same average and deviation.
Sharing one average and one deviation between the lines is what makes the pane trustworthy: the crossing you see is exactly the crossing of raw OBV and its own 20-bar mean, not an artifact of scaling each line separately. It is also why loading older history does not shift the pane or leave a step where two windows join.
Honest limitations, and they matter. The volume is measured, but the direction is inferred, and that is the real weakness rather than the data. The sign is crude: a bar closing up by a hundredth of a percent credits its entire volume as buying, so a green close on heavy selling still reads as accumulation. Gaps are attributed to the gap bar. Because the normalisation is local to the window, a shift in a symbol's volume regime widens the deviation and can make a genuinely large run read as a modest one. And it needs real volume, so it is hidden on ratio charts and deserves more caution on crypto, where volume is per-venue and partly washed.
Key settings
These recompute the chart:
- Z window: 20 to 400 bars (default 100), the window the standard deviation is measured over. Shorter makes the line jumpier and the zones easier to reach.
- Mean SMA: 2 to 400 bars (default 20), the length of the yellow line.
- Source: close-sign, the bar-direction method above. Measured buy and sell volume from the consolidated tape is in development and will appear here as a second option.
The two lengths must differ. Set equal, the average being measured against would be the mean line itself, and the yellow line would collapse onto zero.
Alerts
6 alert types: OBV crossed above or below its mean, bullish and bearish divergence against price, and the line reaching plus or minus two standard deviations. The crossing alerts fire only on a genuine change of side, never on the line hovering near its mean.
Availability
Equities and crypto charts. Not available on pairs charts, which have no volume to count. Included from the Plus plan up.
OBV z-score is an AI Trading Desk indicator. See it on a live chart in the AI Trading Desk, or browseevery guide.
Educational and analysis purposes only. Not financial advice. See theterms.