
Purpose
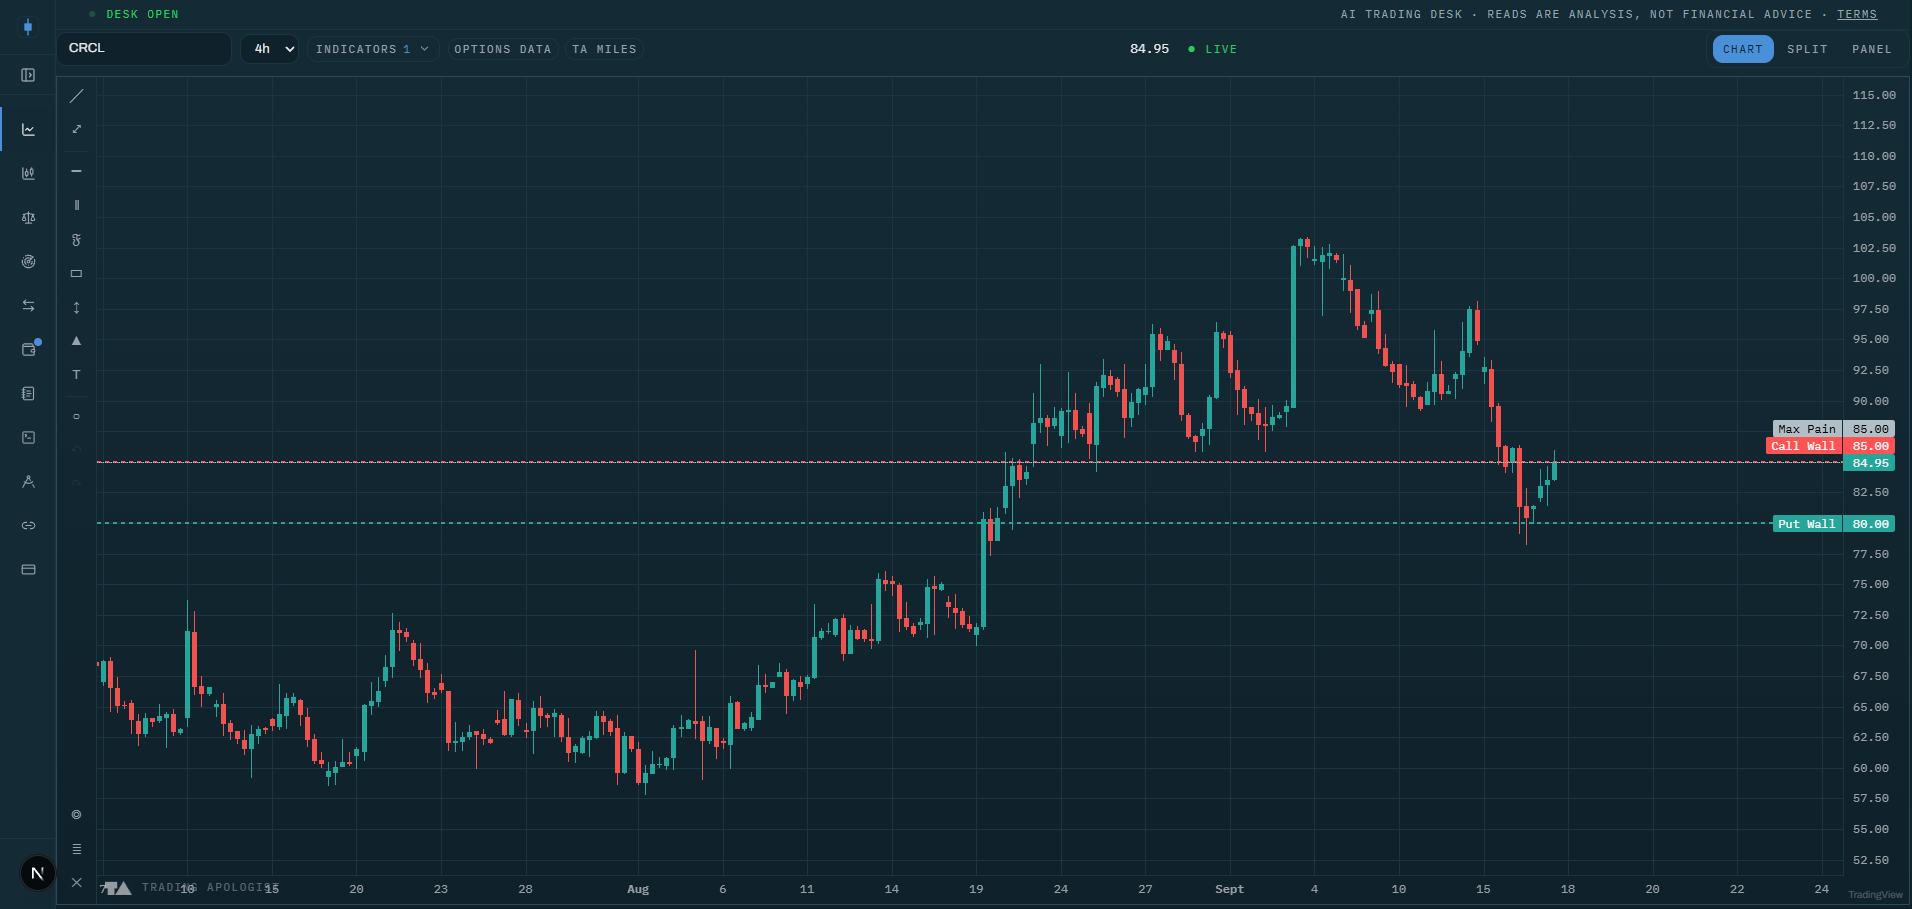
Option walls marks the four prices that options positioning cares about most on the charted stock: the call wall, the put wall, the gamma flip, and max pain. These are the strikes where dealer hedging concentrates, so price tends to slow down, stall, or react when it reaches them.
It is the quickest way to put the options market's map on your price chart without opening a chain.
Best used for:
- Sanity-checking a target: a call wall sitting just above your target is a reason to take profit early, not to hope through it.
- Finding pin candidates into weekly and monthly expiry, when price often gravitates toward max pain and the heaviest strikes.
- Framing intraday ranges: on many liquid names the day's chop lives between the put wall and the call wall.
- Knowing which side dealers are leaning: above the gamma flip, hedging dampens moves; below it, hedging amplifies them.
What you see on the chart
Four horizontal price lines on the price pane:
- Call wall in red: the strike carrying the heaviest call-side gamma. Overhead, it tends to cap rallies.
- Put wall in teal: the strike carrying the heaviest put-side gamma. Below price, it tends to catch dips.
- Gamma flip in orange: the price where net dealer gamma changes sign. It behaves like a regime line rather than simple support or resistance.
- Max pain in grey, dotted: the price where the most option value expires worthless. A gravity level into expiry, not a trade trigger.
Line thickness carries information: the call and put walls are drawn thicker when their gamma weight is heavier relative to the rest of the ladder, so a fat line is a wall the market actually respects and a thin line is a minor one.
In the bubbles style, the call and put walls move into a column of size-scaled circles in the right gutter (bigger circle, heavier wall) and their lines collapse to axis labels. The gamma flip and max pain always stay as lines, because they are prices, not sizes.
How to read it
- Walls are magnets first, barriers second. Price is drawn toward heavy strikes as dealers hedge, then reacts when it arrives. The first touch of a strong wall is the highest-quality reaction.
- Respect the thickness. A thick call wall rejected twice is a real ceiling. A thin wall is a waypoint; do not build a trade around it.
- The gamma flip splits your playbook. Above the flip, fade moves toward the walls and expect chop. Below the flip, breakouts run further than they look like they should, so trail rather than fade.
- Max pain matters most in the final sessions before expiry. Far from expiry it is background information. In expiry week, a drift toward max pain with no news is normal behavior, not a mystery.
- Walls move. Positioning is rebuilt daily. A wall that migrates up day after day is bullish structure; a call wall that steps down toward price is supply pressing in.
If you also run the GEX Profile indicator with its corrected walls on, those corrected lines replace the raw call and put wall lines from this indicator, and the menu notes it. The GEX version filters out walls on the wrong side of price.
How the engine works
The levels come from Unusual Whales options positioning for the charted stock. The backend extracts the heaviest call-gamma strike, the heaviest put-gamma strike, the net-gamma flip price, and max pain, each with a strength score measured against the heaviest strike on the ladder. That strength score drives the line thickness and the bubble size.
The data refreshes with the chart series. It reflects current open positioning, so it changes as positions open and close, most visibly overnight when open interest updates.
Honest limitation: walls are an estimate of where dealer hedging concentrates, built from open interest and gamma. They describe where reactions are likely, not guaranteed. On thin, low-open-interest names the walls can be noise; the thickness cue is your guide to how seriously to take them.
Key settings
- Style:
linesorbubbles (right gutter). Bubbles keep the pane clean when you run several level-based indicators at once. - Labels:
full(name plus strength, like "Call Wall 72"),minimal(short tags CW, PW, GF, MP), oroff. - Opacity: 10 to 100 percent, fades the lines without removing them.
Availability
US equities only; not available on pairs or crypto charts. Included from the Starter plan up, the earliest chart indicator unlocked on the desk.
Option Walls is an AI Trading Desk indicator. See it on a live chart in the AI Trading Desk, or browseevery guide.
Educational and analysis purposes only. Not financial advice. See theterms.