
Purpose
VRP History shows what the options market charged for volatility against what the stock then actually delivered, as a continuous series.
The gap between those two is the volatility risk premium, and it is the structural reason option selling works at all: implied volatility sits above realised volatility more often than not, and that spread is the seller's edge. This pane shows whether it is present today, how large it is, and how large it is compared with this symbol's own year.
Where the VAYO indicator marks the moments when selling premium is favourable, VRP History shows the whole series those marks are drawn from. The two are separate indicators and either runs without the other.
Best used for:
- Deciding whether premium selling has an edge on this name right now.
- Sizing that trade: a positive premium at the 98th percentile is a different proposition from the same premium at the 40th.
- Catching the regime change when realised volatility starts beating implied and long premium becomes the right side.
- Sanity-checking a VAYO mark against the conditions that produced it.
What you see on the chart
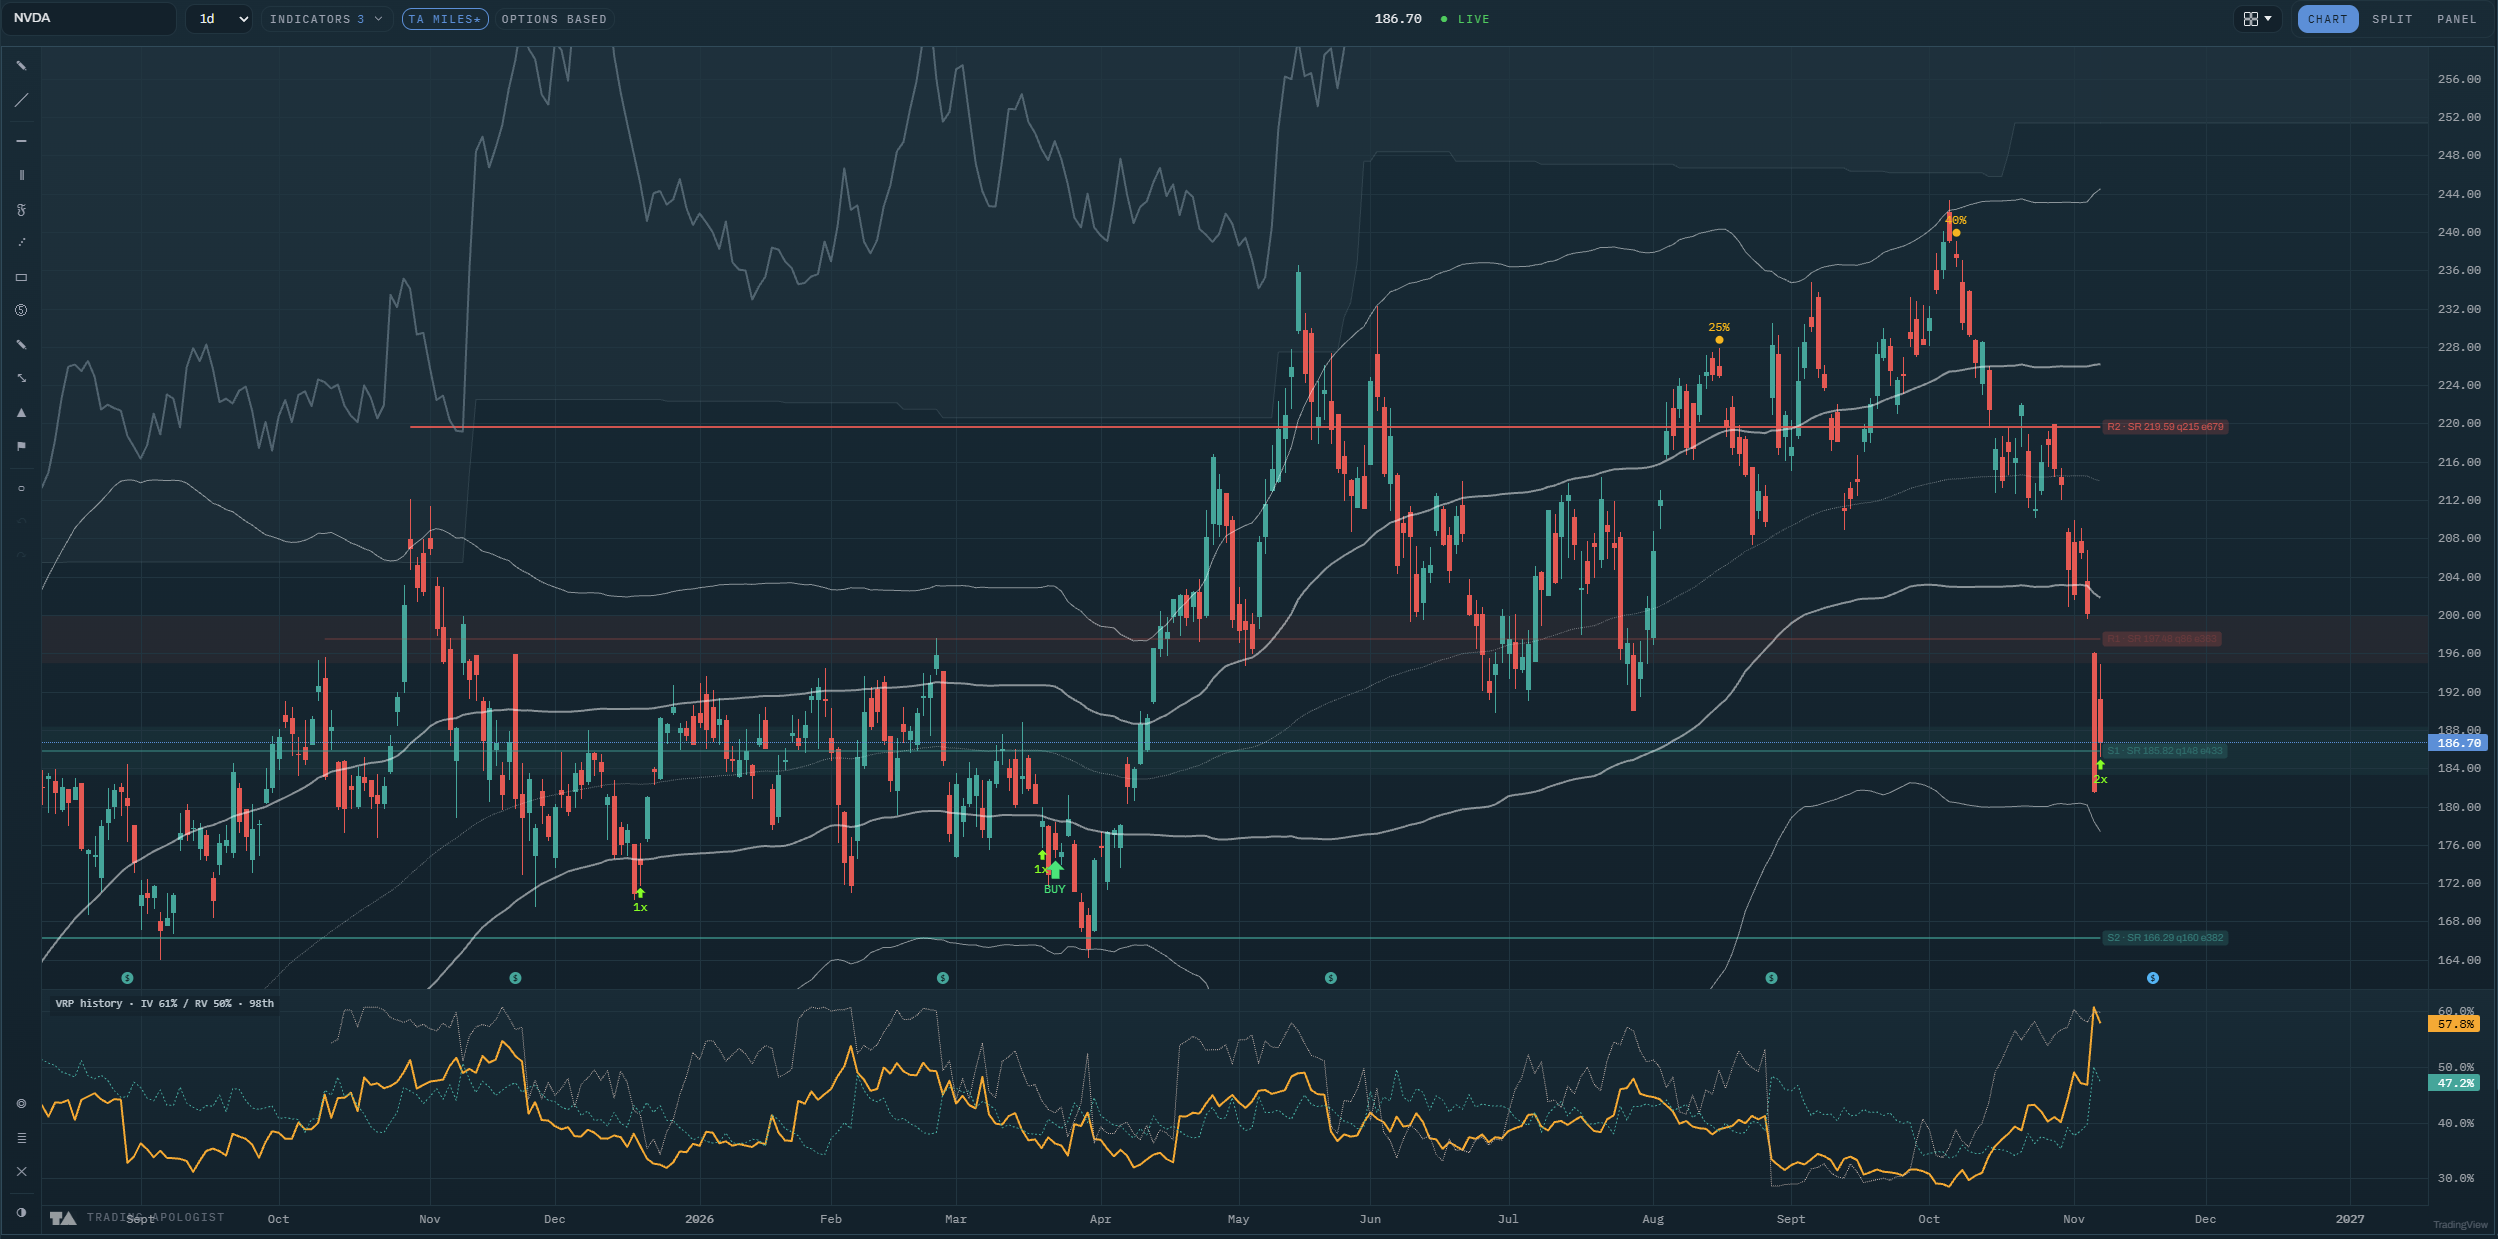
A pane below price carrying up to three lines, deliberately in different shapes so you can tell them apart without the legend:
- Implied, as a solid line: what the options market charged for volatility.
- Realised, as a dashed line: what the stock then delivered.
- The premium percentile, as a dotted line: where today's gap between the two sits in this symbol's own trailing range, 0 to 100.
The legend reads the current state directly, for example "VRP history · IV 61% / RV 50% · 98th".
How to read it
- Solid above dashed means sellers are being overpaid. The market charged more for movement than the stock delivered, and that difference is what a premium seller collects.
- Dashed above solid flips the trade. Realised volatility beating implied means options were too cheap for what actually happened, and long premium was the right side. Sustained, it is a regime change rather than noise.
- The percentile decides size, not direction. A positive premium is common; a positive premium in the top decile of its own year is unusual, and that is the part worth pressing.
- Watch the two lines converge. Implied falling toward realised is the premium being competed away, often after an event passes. The edge shrinks before the lines cross.
- A high percentile with a narrow gap is still a thin trade. The percentile ranks the gap against this symbol's history, so on a calm name even a small absolute premium can rank highly.
How the engine works
Implied volatility is taken from the options market. Realised volatility is computed from the stock's own daily closes over a matching window, so the two are measured on comparable terms. The premium is the difference, and the percentile ranks today's difference against the same symbol's trailing history.
Both legs update daily, which is why this draws on daily and weekly charts.
Honest limitation: realised volatility is backward looking by construction. It describes the window just ended, and a stock that is about to become volatile looks calm right up until it does not. The premium is a statistical tendency, not a guarantee on any single trade.
Key settings
- Implied: the solid leg, with colour, width and line style.
- Realised: the dashed leg, same controls.
- Premium percentile: the dotted 0 to 100 line, on or off.
Hiding both legs leaves an empty pane, and the indicator menu says so rather than letting you wonder.
Availability
US equities with a listed options chain, daily and weekly charts. Not available on pairs or crypto charts. Included from the Pro plan up.
VRP History is an AI Trading Desk indicator. See it on a live chart in the AI Trading Desk, or browseevery guide.
Educational and analysis purposes only. Not financial advice. See theterms.