
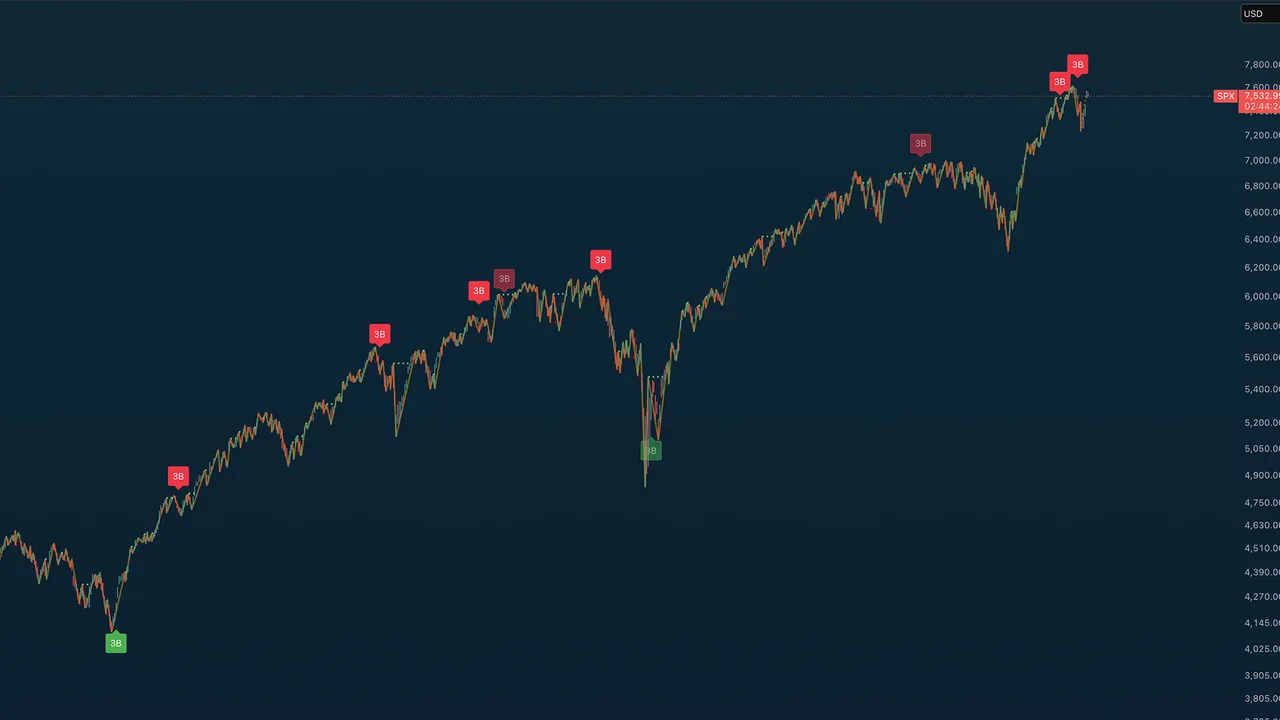
Draws the market's swing structure for you: W.D. Gann's swing highs and lows, break-line projections, and his classic 3-bar reversal rule, with strict gating so mid-trend bounces never print a signal, but structural tops and bottoms do.
What you see on the chart
- Orange swing lines connecting confirmed pivots, with a dotted line for the current, unconfirmed leg.
- Swing break lines: lime when price closes through a prior swing peak, red when it closes through a prior trough. These are the structure-break reads.
- "3B" labels: Gann 3-Bar Rule signals: a sell after three consecutive down bars off an ultimate swing high, a buy after three consecutive up bars off an ultimate swing low. Full-opacity labels are strict three-in-a-row; faded labels allowed one interruption.
- Optional bar-type classification: up bars (green ▲), down bars (red ▼), inside bars (gray ●, ignored by the swing logic), outside bars (blue ◆).
How to read it
The gating is the value. A 3B signal only fires off an ultimate swing (the most extreme pivot in a long lookback), with cooldown and minimum-move filters, and a correction-depth check measured in ATR multiples, so a routine dip and a genuine correction aren't treated the same. Signals are for Daily charts and up; below that the indicator stays quiet by design. Use the swing and break lines continuously for structure; treat 3B labels as the rare, high-value events they're tuned to be.
Key settings
Swing/break-line toggles, 3-bar strictness (allow one inside/outside bar interruption), ultimate-swing lookback, minimum bars between signals, cooldown override threshold, bar-type markers, and optional seasonal dates.
Alerts
Gann 3-Bar Buy and Gann 3-Bar Sell (Daily and above).
TA Gann Swing Indicator is a Trading Apologist TradingView indicator.Request access to the scripts, or browseevery guide.
Educational and analysis purposes only. Not financial advice. See theterms.