
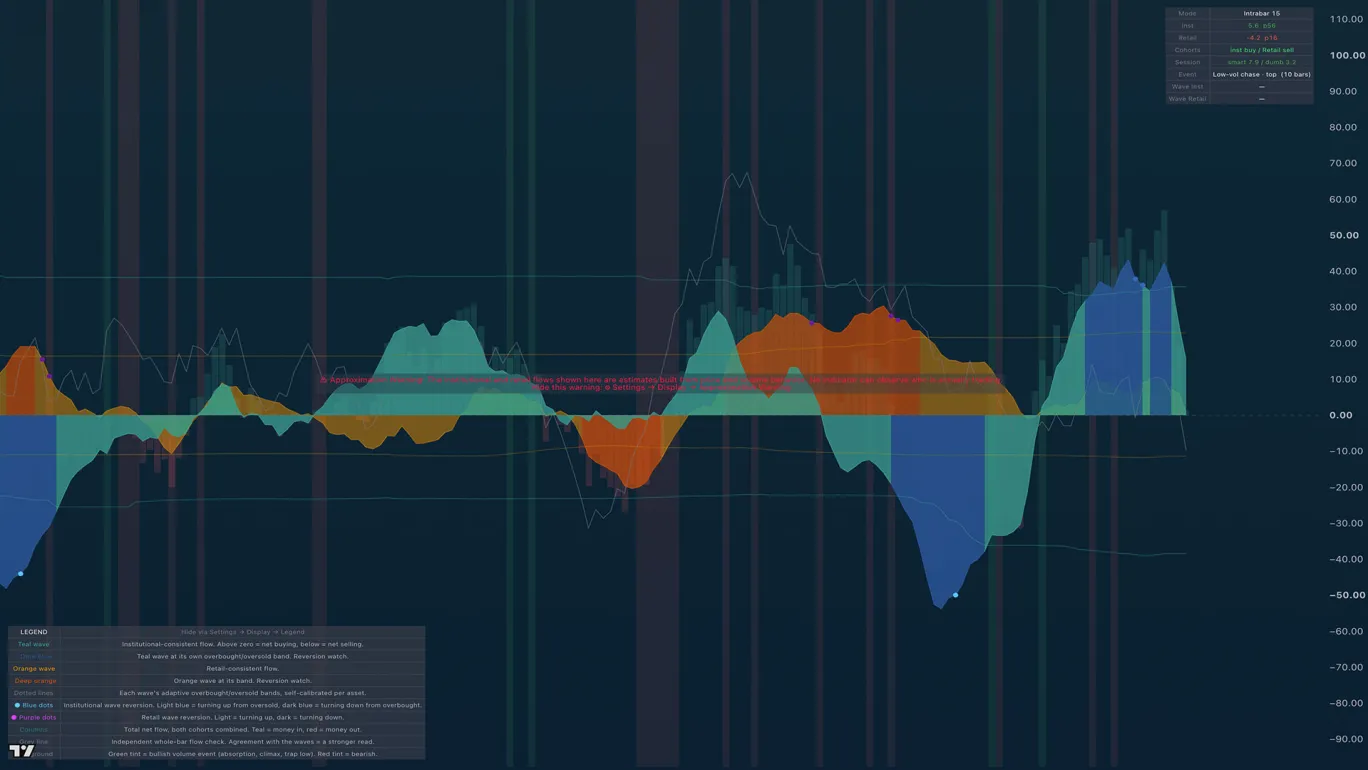
Splits every bar's volume into institutional-consistent and retail-consistent flow, and shows you when either side is exhausted. Money Flow is a lower-pane engine that separates money flowing in versus out of an asset, assigns it to two participation cohorts by print size, and flags the classic accumulation and distribution footprints as they form.
What you see on the chart
- Stacked flow waves for the two cohorts, large-print (institutional-consistent) and small-print (retail-consistent), each normalized to a common scale so their pushes and retreats are directly comparable.
- BUY / SELL marks when the cohorts split in the classic way, reversion dots on exhausted waves, and effort events: climaxes, absorption/stopping volume, churn, and low-volume traps.
How the engine works
Intrabar volume is signed into buy/sell delta from lower-timeframe data, then split into cohorts by a rolling large-print percentile. On top of that sit behavior detection (effort-versus-result events gated by each cohort's own history) and session priors: the opening half hour leans retail, the closing hour leans institutional. A mean-reversion layer runs on the cohort waves themselves, flagging when a wave is stretched past its own normal behavior.
The signals
- BUY (cohort flip): retail flips to net selling while institutions flip to net buying within a tight window; SELL is the mirror. STRONG marks both flips landing on the same bar.
- Quality filters (on by default) require the flip to be decisive, deep, and well-located before it prints.
- An alternate evidence engine flags TURN events (an institutional-flow zero-cross after a tail extreme) and DIV events (quiet accumulation against flat or falling price), each gated on multiple pieces of confirming evidence.
An honest caveat
No indicator built on price and volume can observe who is actually trading. What this engine measures is abnormal, large-lot-consistent effort and absorption-consistent behavior (the classic Wyckoff/VSA footprints), not literal identity. Treat the cohort labels as well-founded proxies, and read the signals as the story behind the tape, told honestly.
How to read it
The highest-value reads are the divergences: institutions accumulating while price is flat or falling (quiet accumulation), or retail buying enthusiastically into a top while the large-print wave withdraws (distribution). The reversion dots tell you when a wave (either cohort's) is exhausted and due to rotate.
Alerts
30 alerts across cohort flips, strong flips, reversion events, and the effort-event families.
TA Money Flow is a Trading Apologist TradingView indicator.Request access to the scripts, or browseevery guide.
Educational and analysis purposes only. Not financial advice. See theterms.