
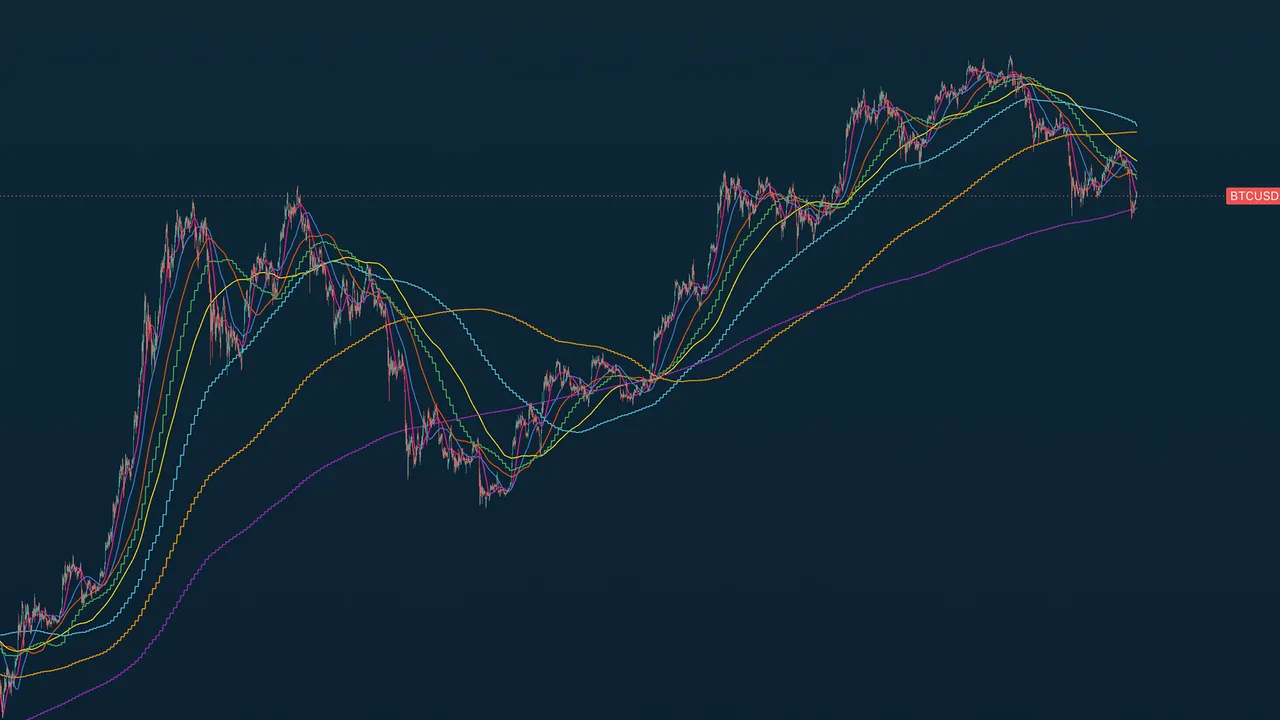
The classic daily and weekly moving averages, always true to their real values on any chart timeframe. Most MA indicators recalculate on whatever chart you're viewing: a "200 SMA" on a 4H chart is a 200-bar 4H average, not the 200-day institutions actually trade against. This one anchors every line to its home timeframe.
What you see on the chart
Eight timeframe-anchored simple moving averages: the 20, 50, 100, and 200 day and the 20, 50, 100, and 200 week, each computed on its true timeframe and drawn on whatever chart you're using, plus five custom slots for your own additions.
The color hierarchy keeps them readable at a glance: the 20-day (pink) and 20-week (green) mark the institutional buyer zone; the 50-day (royal blue) and 50-week (cyan) are the primary trend filters; the 100s (orange/amber) the intermediate reads; and the 200-day (yellow) and 200-week (purple) the long-term anchors.
How to read it
These are the levels everyone else is watching, which is exactly why they matter: reclaim/loss of the 50-day, tests of the 200-day, and the 20-week as bull-market support are among the most-traded reference points in markets. Having them exact, on any chart, removes a whole class of silent errors.
Free for everyone on TradingView.
TA Moving Averages is a Trading Apologist TradingView indicator.Request access to the scripts, or browseevery guide.
Educational and analysis purposes only. Not financial advice. See theterms.